Q1 2022 DDoS attacks and BGP incidents
The first quarter of the year 2022 has passed; now, it is time to look at the events of Q1 in terms of mitigated DDoS activity and recorded BGP incidents.
Again in Q1 2022, we see a shift in the distribution of the vectors. In Q1 2022, the top-3 DDoS attack vectors were:
SYN flood accounting for 37.18% of attacks;
IP flood with 28.92% share of all the attacks;
And UDP flood with 14.86%.
In Q4, 2021, UDP amassed a third of all the attacks, and SYN was responsible for almost 23%, as well as IP for a little more than 20%. In the first quarter of 2022, the picture changed: now we again have a majority of attacks falling into the SYN flood category, and UDP flood dropping significantly compared to the Q4 2021. IP flood grew slightly in Q1 2022.
Together, these three vectors combined make 80.96% of all the statistics — 4% growth compared to the previous quarter, which means that combinations of different vectors were slightly less prevalent among DDoS attacks originators in Q1 2022.
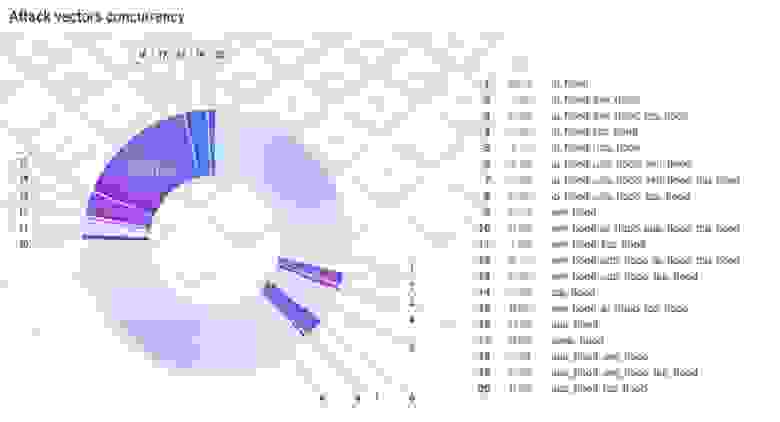
In Q4 2021, the most notable concurrent vector combination — UDP flood mixed with the IP flood, made 7.29% of the total statistics. In Q1 2022, it is «only» 4.19% — a significant drop compared to the previous observations.

Q1 2022 was game-changing from the perspective of attack duration. We observe continuous growth in both median and average attack duration, adding 120 and an astonishing 9 523.76 seconds, respectively.
Such an astronomical rise in the average attack duration is connected to the maximum attack duration we observed in Q1 2022: 922 830 seconds — 15 380.5 minutes — 256.3 hours — almost 11 days of a continuous assault.
Previously we wrote that the overall trend of shortening attacks duration is sustainable, but it seems that Q1 2022 changed that, with the malicious activity growing worldwide. We will see in the second quarter of 2022 if that situation continues.

In the clean (without concurrency) attack vectors distribution picture, we see a slight change in the proportions of major vectors. In Q1 2022, the largest enabled attack vector was SYN flood, with 37.41%. IP flood stands in second place with a slightly lower 30.64% share. And UDP flood contains 23.88% of all the attacks mitigated in Q1 2022.
The rise of the SYN flood could be connected to the growing number of L7 (application layer) attacks that grew significantly during Q1 this year. And the IP flood almost always stays as a second popular vector, even when the leader changes from UDP flood (in Q4 2021) to SYN flood.

And there are no surprises in the attack vectors duration data. IP flood shows lesser digits compared with the other three vectors, where the median (Q50) is substantially higher.
We can also see the most prolonged mitigated attack falling into the UDP flood category.

Quarter over the quarter — UDP flood shows the largest, and SYN flood the minor numbers. In Q1 2022, the maximum attack bandwidth reached 556.85 Gbps of UDP flood. The TCP flood stands in second place, with an attack reaching 551.17 Gbps.
UDP also reigns on the average side of data, but not in the median, where TCP flood shows a slightly higher number.
In the quarterly reports, we register the development of average (L3 — L4) attacking bandwidth quarter over quarter. In the last quarter of 2021, the average attacking bandwidth was 5.62 Gbps — slightly more than in Q3 but still almost twice as low as Q1. In Q1 2021, it was 9.15 Gbps (the largest), in Q2 2021 — 6.5 Gbps, and in Q3 2021 — 4.31 Gbps.
As we will see further, the bandwidth of attacks dropped significantly during Q1 of 2022, translating into the lowest average bandwidth of attack we’ve seen in recent years — 4.17 Gbps. This number is valid for volumetric attacks only.

Same as in Q4 2021, UDP flood shows the most significant maximum (136.77 Mpps), but the average (2.92 Mpps) and median (717 030 pps) are dominated by TCP flood.
It is also important to note that, unlike previous quarters, during Q1 2022, most attacks were in the comparable range of 100K pps to 1M pps.

As we already mentioned, there was a dramatic increase in low bandwidth attacks — from 1 to 10 Gbps, in Q1 2022. The «whale» span of 100+ Gbps attacks lost almost six and a half percent of attacks, and the 10 to 100 Gbps span extracted nearly 13% in favour of the smallest bandwidth range.

That astonishing number of devices participating in an attack — 901 600 — is probably a record for Qrator Labs. At the same time, we’re not considering this number to be a «botnet». The attack in question happened through a Javascript exploit installed on one of the websites. It referred its legitimate users to produce requests intended and aimed at another website. This action was viewed as an attack. It flooded the server with illegitimate (meaning that the user did not directly request the webpage) traffic.

Our third attempt to categorize application layer, or L7, DDoS attacks.
The picture looks quite familiar, as it is only a few percent different from what we saw in Q4 2021.
Again, the largest category is Broken HTTP semantics. «Broken» means different deviations from the usual or expected user’s behaviour, with more than a third of all attacks — 35.13%.
Request Rate Patterns include everything that stands out from what is expected from a legitimate user in terms of request rate analogically to the previous category and collected 25.9% of Q1 2022 application-layer attacks.
That differs from the third category of Abnormal URL traversal, which is precisely what it sounds like — an action that a legitimate user often doesn’t even have the ability to make, where we saw 10.57% of attack data.
Combined, those top three categories are responsible for 71.6% of the L7 attacks, with 12.93% in Multiple Matched Criteria, where we put all concurrent attacks.

Last year, during Q4 2021, in November, we reported the single largest number of BGP hijacking ASes — 17 798, which at the time was 16.3% of all registered ASNs according to IANA, and a 22.3% of all active ASNs according to Qrator.Radar data.
In March 2022, we saw a number that is only slightly lower — 15 554 hijacking ASes. Yet, the number is still very high, as the number of unique hijackers in Q1 2022 is 18 350, compared with 19 959 in Q4 2021.

The same situation is with individual BGP route leaks and hijacks in Q1 2022. Although there are no new record numbers, the digits don’t drop from high levels in both instances. Remember, here, we count the total number and not the unique routing incidents — if one AS originates a route leak, that is distinguished as a separate one by the Qrator.Radar model — we count it in.
In December of 2021, we saw a record-high number of route leaks — more than 10 000 000. But as you can see, the trend continued into January, when there were registered more than 8 000 000 BGP route leaks.
Now, let us look at the global incidents that are part of these statistics through each month of the quarter.
Reminder note: Qrator.Radar team has a set of certain thresholds that separate global incidents from the rest. They include affected prefixes, affected autonomous systems, and the incident’s distribution among routing tables.
Global BGP Route Leaks in Q1 2022:
January: 1
February: 1
March: 2
One could find a detailed description of these incidents according to the occurrence date in the Qrator.Radar Twitter feed.
Global BGP Hijacks in Q1 2022:
January: 1
February: 0
March: 0
Data sources and observation methodology
Qrator Labs' Quarterly and Annual Reports are based on the data from observed attacks on web pages and servers under the Qrator Labs' DDoS attacks mitigation service and customers insights on the mitigated attacks. The figures and data were collected according to the report’s scope timeframe, i.e., a specific calendar quarter or calendar year.
Each report consists only of the attack data Qrator Labs directly observed («mitigated»). Qrator Labs does not collect or analyze traffic outside of its network, meaning that all the conclusions we draw are based solely on the data passing through the Qrator BGP anycast network. By 2022 Qrator Labs' anycast network exceeds 3 Tbps of filtering capacity built upon 15 points-of-presence, each connected to a Tier-1 ISP.
Qrator.Radar analyzes BGP paths data collected from more than 800 sessions, serving analytics and real-time incident monitoring to the registered and authenticated owners of Autonomous Systems. Qrator.Radar provides a user with historical data on AS connectivity (links), BGP routing anomalies, and network-related security issues.
Qrator.Radar is the BGP monitoring and analytics tool and the vulnerability scanner for known networks.
That means that when scanning a network, Qrator.Radar analyzes the presence of any known amplificators and the amplification (https://en.wikipedia.org/wiki/Denial-of-service_attack#Amplification) factor itself. This data is further processed to give ISP (or, more precisely, ASN) owners the possibility to analyze the availability of any of those services, which attackers could exploit for DDoS attacks.
Such scans are not harmful in any way to the company’s hardware or software, Qrator.Radar collects the data only to notify the rightful owners of the network of when and which amplificators became available within the networks they manage. We require authorization from the ASN owners before showing this kind of information we consider sensitive.
Besides the network data and its analysis Qrator Labs also employs open-source intelligence analysis within the public reports. Qrator.Radar, in turn, uses data from publicly available databases to get the IRR, RPKI and geolocation information to correlate between own and open-sourced data.
