Q4 2022 DDoS Attacks and BGP Incidents

Now that 2022 has come to an end, we would like to share the DDoS attack mitigation and BGP incident statistics for the fourth quarter of the year, which overall saw unprecedented levels of DDoS attack activity across all business sectors.
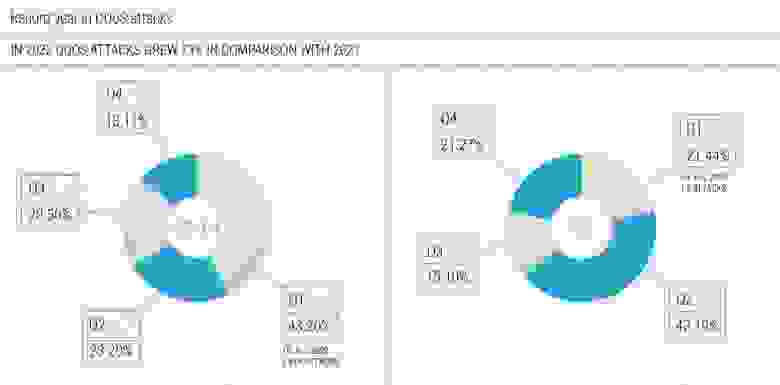
In 2022, DDoS attacks increased by 73.09% compared to 2021.
Let’s take a closer look at the Q4 2022 data.

In the fourth quarter of 2022, the following attack vectors were prevalent:
UDP flood, accounting for 37.05% of all L3-L4 attacks;
SYN flood, responsible for 26.84% of volumetric attacks;
and IP flood, with a smaller share of 13.8%.
UDP flood prevailed as the leading attack vector throughout the year, except for the first quarter of the year, when the SYN flood was the top technique.
Compared to the third quarter of 2022, the share of IP flood attacks increased significantly — from 0.64% to 13.8%. This is a sudden change after several quarters of decline since Q3 2021, when IP flood was responsible for a staggering 55.49%. In the Q3 2021 report, we wrote:
«As we mentioned earlier, the interchange between IP (fragments) flood and UDP flood quarter over quarter is somewhat highly expected. Additionally, we expect this trend to stay in the future.
The reason is attackers are trying to improve the overall efficiency of their devices by choosing larger amplification targets (like DNS records), and it is pretty standard that those chunks of data significantly surpass the MTU limit. Thus fragmentation is inevitable.»
Although up until Q4, the UDP flood was reigning as the primary attack vector, making more than half of the attacks our network mitigated.
The top-3 vectors combined make 77.69% of all the mitigated attacks — 7.68% more than in Q3 2022.

Comparing the duration data QoQ, the average attack time has almost doubled — from 1510 seconds in Q3 2022 to 2503 seconds in Q4. However, the median duration decreased for the first time since Q2 2022, from 390 seconds to 210 seconds.
Looking at Q75 and Q90, attacks in Q4 2022 were the shortest of all 2022 attacks.
But the longest attack in Q4 lasted for 250 500 seconds — more than 69 hours, which is still less than what we’ve seen during Q2 2022 when one of the attacks lasted more than 100 hours.

In the attack vector statistics without concurrency, we again see the prevalence of the UDP flood, although the proportion is lower than in Q3 when it was 51.79%. The SYN flood has gained the most, rising from 20.37% in Q3 to 41.34% in Q4.

In the statistics for the duration of the individual vectors, we see the return of the picture we already saw in Q2 2022 — the SYN flood with the longest duration, followed by the IP flood, which gained significant values QoQ. Unlike the previous quarter, when the UDP flood had the highest Q75 and Q90 values, in Q4 the SYN flood had the higher Q90, associated with the longest attack of 250 500 seconds.

On the bandwidth side of the attacks, we see that UDP flood and TCP flood are closer at the maximums — 621.86 Gbps and 480.8 Gbps respectively. However, the difference is much more significant in the median, where the UDP flood shows 1.79 Gbps, which is still more than two times lower than the IP flood median bandwidth of 3.71 Gbps.
The bandwidth range from Q10 to Q90 for the UDP flood, which narrowed in Q3, shrank even more in Q4.
In the quarterly reports we register the development of the average (L3 — L4) attack bandwidth from quarter to quarter. In the last quarter — Q3 2022 — the absolute average was 8.30 Gbps, slightly less than the highest average bandwidth in the past — 9.15 Gbps in Q1 2021.
In Q4 2022, the average attack bandwidth was 9.736 Gbps — the record average bandwidth in 2022. These values only apply to volumetric attacks.
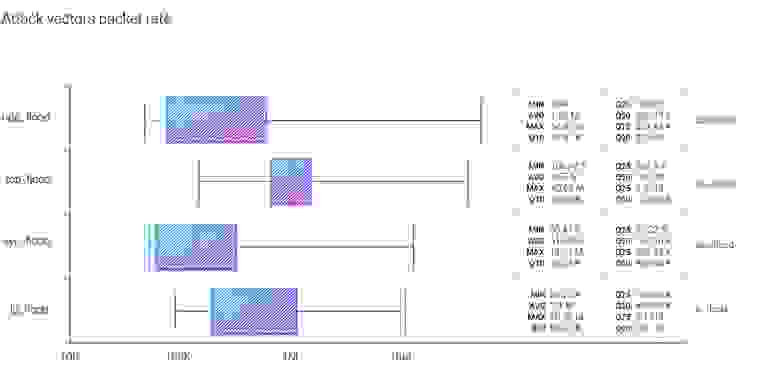
As usual, UDP flood leads the packet rate statistics quarter after quarter, with the dominant average, Q75 and Q90. On the median side of the packet rate, TCP flood shows the most significant value, although the maximum still falls into the UDP flood basket with an attack of 54.81 MPPS.
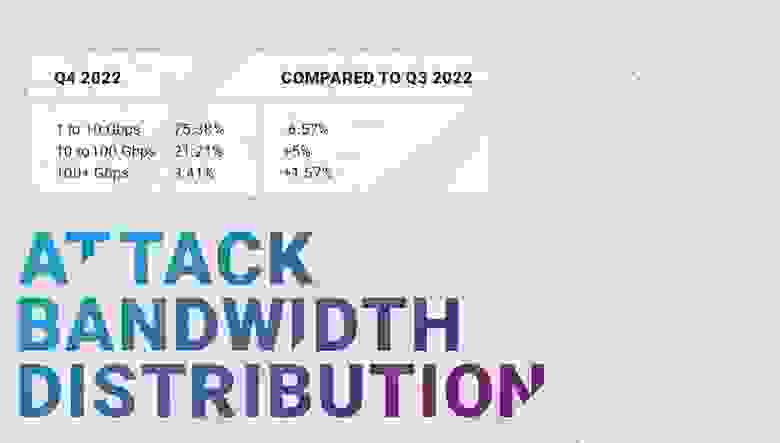
In the previous quarter — Q3 2022 — the middle range of 10 to 100 Gbps attacks lost some percentages, which it regained in Q4. But now only 75% of attacks fall into the smallest range, with the 'whale' 100+ Gbps attacks growing to 3.41% — twice as much as in Q3 2022.

We didn’t see large numbers of attack sources, networks, botnets, etc. The largest attack source in Q4 was 59,323 devices — a significant drop from Q3's 115K and Q1's record 1M devices.
While attackers didn’t set any absolute records in 2022, the overall 73% growth across mostly European countries we saw is a huge shift in the threat landscape.
Q4 2022 is the sixth quarter in which we attempt to categorise the application layer, or L7, DDoS attacks.
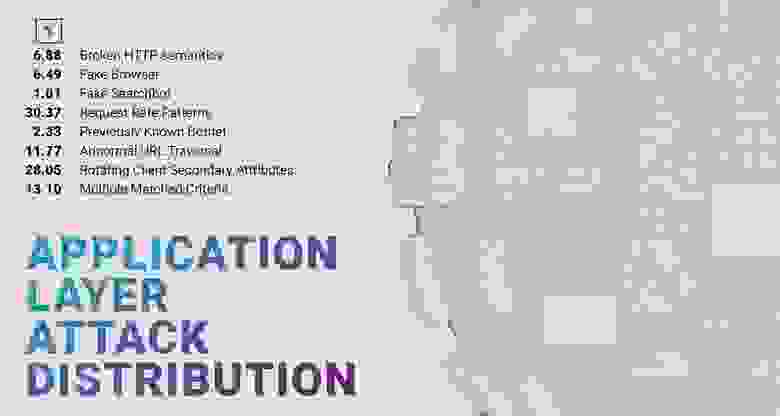
Unlike Q3, the largest category in Q4 2022 is Request Rate Patterns, which includes anything that deviates from what is expected from a legitimate user in terms of request rate, and collected 30.37% of Q4 2022 application layer attacks.
It is followed by Rotating Client Secondary Attributes, which refers to an unusual set of headers in the request, and accounts for more than a quarter — 28.05% — of L7 DDoS attacks.
That differs from the third category, Abnormal URL Traversal, which is exactly what it sounds like — an action that a legitimate user often wouldn’t even be able to perform, where we saw 11.77% of the attack data.
Broken HTTP semantics now accounts for «only» 6.88% of L7 attacks.
The top four categories together account for 77.07% of L7 attacks, with 13.10% in Multiple Matched Criteria, where we put all concurrent L7 attacks.

We stopped publishing the amplificators statistics in 2020. This time we have decided to bring them back after a two year break. The data is for 2022 — the number of amplificators/reflectors publicly available on the internet and the average amplification factors we’ve registered.
At the end of 2020, the largest average amplification factors belonged to Chargen (77.1x), ICMP (69x) and CLDAP (42.8x). By the end of 2022, the top 3 amplifiers are almost the same! In 2022 they were Chargen (80.6x), ICMP (73.36x) and NTP (67.41x) — the only change in two years. The most widely used amplificators are, of course, the DNS recursors.

Looking at the number of unique BGP route leakers and unique BGP hijackers, it would appear that nothing is happening — which is far from the truth. The number of unique route leaking ASes remains roughly the same as in Q3 2022, and the number of unique hijacking ASes has decreased slightly compared to Q3.

Remember, here, we are counting the total value and not the unique routing incidents — if one AS originates a route leak, that is distinguished as a separate one by the Qrator.Radar model — we count it in.
In Q4 2022, Qrator.Radar recorded 3 302 772 individual BGP route leaks — four times fewer than in Q3. But the number of hijacks remains almost the same — Q4's 2 210 264 hijacks are hundreds of thousands fewer than a quarter ago.
Let us now look at the global incidents that are part of these statistics for each quarter month.
Reminder: The Qrator.Radar team has a set of certain thresholds that separate global incidents from the rest. These include affected prefixes, affected autonomous systems and the distribution of the incident across routing tables.
Global BGP Route Leaks in Q4 2022:
October: 0
November: 0
December: 0
Don’t misinterpret these zeroes — route leaks do happen, but in Q4 2022 there were no global routing incidents with BGP route leaks.
A detailed description of these incidents by date of occurrence can be found on the Qrator.Radar Twitter feed.
Global BGP Hijacks in Q4 2022:
October: 0
November: 1
December: 1
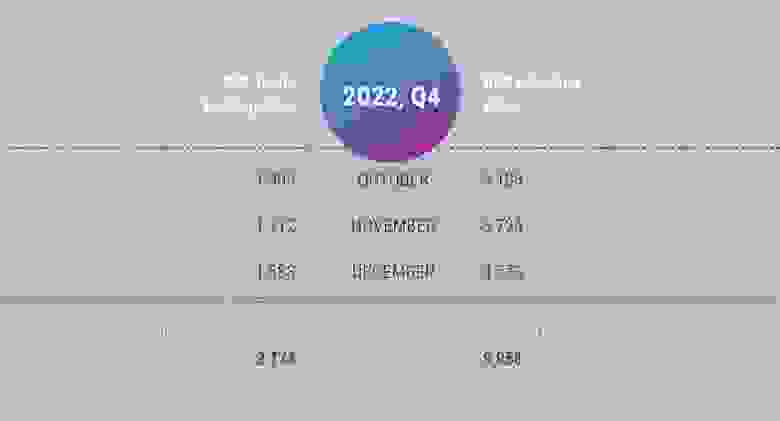
Bot Protection Statistics, Q4 2022

For a few years now, Qrator Labs has been working on a new technology called Bot Protection. Now, for the first time, we’ve decided to take a look at the statistics of bad bot protection and summarise the newly acquired data for Q4 2022.
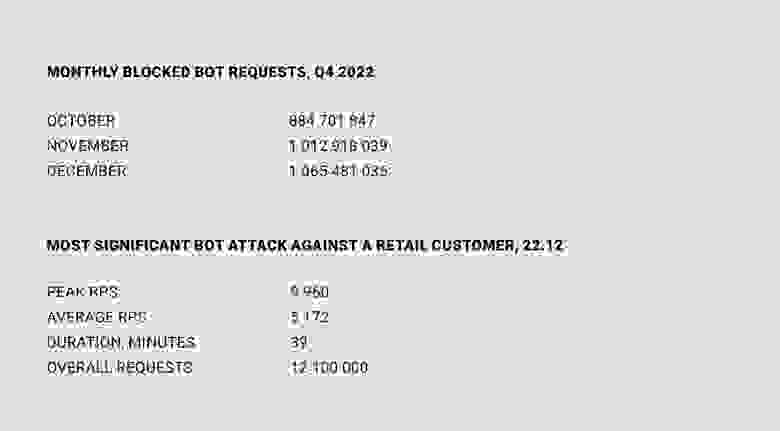
As you can see, the number of bad bot attacks is relatively high — measured in billions of requests — even though Qrator Labs has only recently started offering this product to its customers.
The most significant attack occurred just before Christmas — on 22 December, one of the retail resources was attacked for 39 minutes with an average RPS of 5 172, peaking at 9 960 RPS.
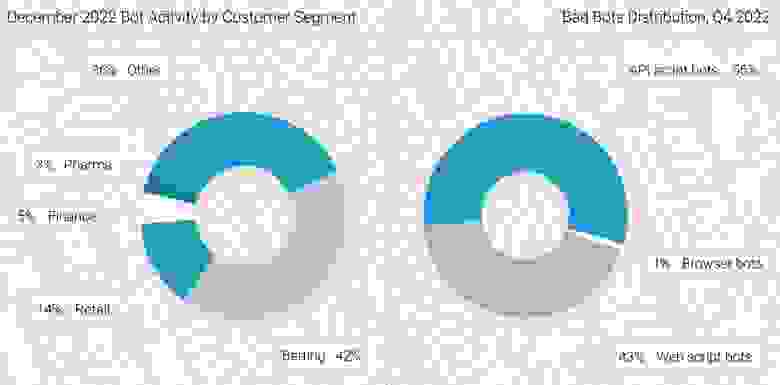
As you can see, there are more and less exposed industries when it comes to automated bot attacks. Betting and retail are the most affected, followed by finance and pharmaceuticals. The bot distribution in Q4 2022 looks somewhat predictable, as it is almost split in two, with a slight prevalence of API script bots.

In compiling this data, we thought that the most interesting part of the bot attack statistics was the overall «background» level of bad bot attack noise. Most actively parsed targets on the Internet are parsed daily, either in bursts or slowly, but 24/7. This is what makes money for the people who develop and run them, as scraping, scalping, brute forcing and other techniques remain in their own niche.
Thank you for reading the Qrator Labs Q4 2022 Report!
Data sources and observation methodology
Qrator Labs' Quarterly and Annual Reports are based on the data from observed attacks on web pages and servers under the Qrator Labs' DDoS attacks mitigation service and customers' insights on the mitigated attacks. The figures and data were collected according to the report’s timeframe scope, i.e., a specific calendar quarter or calendar year.
Each report consists only of the attack data Qrator Labs directly observed («mitigated»). Qrator Labs does not collect or analyze traffic outside of its network, meaning that all the conclusions we draw are based solely on the data passing through the Qrator BGP anycast network. By 2023 Qrator Labs' anycast network exceeded 3 Tbps of filtering capacity built upon 15 points-of-presence, each connected to a Tier-1 ISP.
Qrator.Radar analyzes BGP paths data collected from more than 800 sessions, providing analytics and real-time incident monitoring to the registered and authenticated owners of Autonomous Systems. Qrator.Radar provides a user with historical data on AS connectivity (links), BGP routing anomalies, and network-related security issues.
Qrator.Radar is the BGP monitoring and analytics tool and the vulnerability scanner for known networks.
That means that when scanning a network, Qrator.Radar analyzes the presence of any known amplificators and the amplification (https://en.wikipedia.org/wiki/Denial-of-service_attack#Amplification) factor itself. This data is further processed to give ISP (or, more precisely, ASN) owners the possibility to analyze the availability of any of those services which attackers could exploit for DDoS attacks.
Such scans are not harmful in any way to the company’s hardware or software, Qrator.Radar collects the data only to notify the rightful owners of the network of when and which amplificators became available within the networks they manage. We require authorization from the ASN owners before showing this kind of information we consider sensitive.
Besides the network data and its analysis Qrator Labs also employs open-source intelligence analysis within the public reports. Qrator.Radar, in turn, uses data from publicly available databases to get the IRR, RPKI and geolocation information to correlate between its own and open-sourced data.
