Q4 2021 DDoS attacks and BGP incidents

2021 was an action-packed year for Qrator Labs.
It started with the official celebration of our tenth year anniversary, continued with massive routing incidents, and ended with the infamous Meris botnet we reported back in September.
Now it is time to look at the events of the last quarter of 2021. There are interesting details in the BGP section, like the new records in route leaks and hijacking ASes, but first things first, as we start with the DDoS attacks statistics.

Almost every quarter, there is a slight shift in the distribution of the vectors, so in Q4 2021, the top-3 DDoS attack vectors were:
UDP flood with 33.75%;
SYN flood with 22.71%;
And IP flood with 20.21% of the attacks.
That is, again, a turnaround compared with the Q3, and the same picture as were in Q2. Although last quarter IP flood contained more than half of all the attacks, Q4's leader UDP flood is accountable for only ⅓ of them.
During Q4 2021, these three vectors combined made 76.67% of all the statistics.
The most notable concurrent vector combination — UDP flood mixed with the IP flood (same combination as in Q3), made 7.29% of the total, a significant growth compared to Q3«s 3.41% and even Q2«s 6.6%.
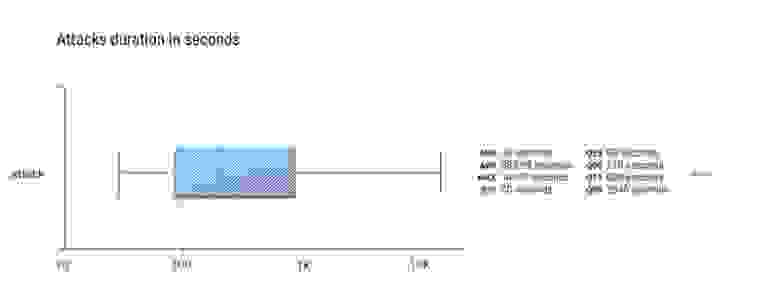
In Q4 2021, median attack time went up 60 seconds compared with Q3, to 210 seconds. The average attack time also gained a bit compared to Q3 by adding 9 seconds up to the 564 seconds of an average DDoS attack.
And while Q25 stays at 90 seconds, the tenth percentile lost half of its value compared to Q3 and dropped from 60 seconds to 30 seconds in Q4.
The majority of attacks are as persistent as ever, and as we reported last quarter, the median attack time of 2.5 minutes was the lowest we ever observed in Q3. And, while in Q4, the median was a full minute longer, make no mistake — the overall trend of shorter attacks hasn’t changed significantly.
Although during the Q4 of 2021 UDP flood reigned with 38.77% of all attacks, IP (fragments) flood is in second place with 27.29%. SYN flood is slightly below with 25.79%, and TCP flood drags as last with 7.5% of all attack data.
Yes, it fell significantly compared to Q3, when IP flood was accountable for more than half (52.72%) of the attacks. Still, we are looking at two sides of probably one and the same technique — choosing larger amplification targets (like DNS records). It is pretty standard that those chunks of data significantly surpass the MTU limit. Thus, some fragmentation is inevitable, although it’s adjustable depending on the attacker’s skill level.

In Q4, the maximum attack duration fell into SYN flood and UDP flood categories, being just a tiny fraction away one from the other — most prolonged SYN flood was 14940 seconds (249 minutes or 4.15 hours), and the most prolonged UDP flood 14970 seconds (249.5 minutes or 4.16 hours).
It is pretty much the same on the median and average side of duration. SYN flood average duration is 705.68 seconds and median 150 seconds. UDP flood average duration is 1228.97 (the highest above all — slightly more than 20 minutes), and the median is 330 seconds.
Above the three most popular attacking vectors, IP flood has the shortest duration numbers, with an average of 267.62 seconds and a 120-second median.

On the bandwidth side of things, we can see that quarter over quarter, there was no change in the leader — UDP flood still shows the largest, and SYN flood the most minor, numbers. Maximum attack bandwidth in Q4 was almost 650 Gbps of UDP flood.
If we look at the average, the situation is different because TCP flood shows the most significant number of 54.07 Gbps per attack with that vector — twice as UDP.
And it is, again, different from the median attack, where ICMP flood assaults were made at the bitrate of 50.93 Gbps.
If you remember, within the quarterly reports, we register the development of average attacking bandwidth quarter over quarter. In the last quarter of 2021, the average attacking bandwidth was 5.62 Gbps — slightly more than in Q3, but still almost twice as low as Q1. In Q1 2021, it was 9.15 Gbps (the largest), in Q2 2021 — 6.5 Gbps, and Q3 2021 — 4.31 Gbps.
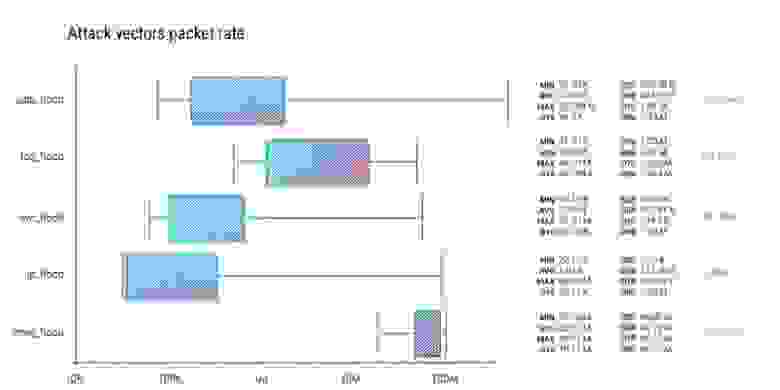
In the Q3 of 2021, it was TCP flood prime time, with the highest average, median and maximum. QoQ, the maximum packet rate was regained by the UDP flood (322 Mpps), and the highest median went to the ICMP flood (69.19 Mpps), as did the highest average (58.23 Mpps).
Although it is necessary to mention that ICMP attacks were on the rise during Q4 2021, we don’t see a lot of them often.

When describing Q3 2021, we wrote that a significant percentage of attacks shifted into lesser bitrate territory. Now we can see the opposite trend in Q4 2021, where 1 to 10 Gbps interval lost almost 10%, that was distributed among 10 to 100 Gbps interval and the most prominent one — 100+ Gbps, with the latter now responsible for nearly 8 percent of all the attacks.
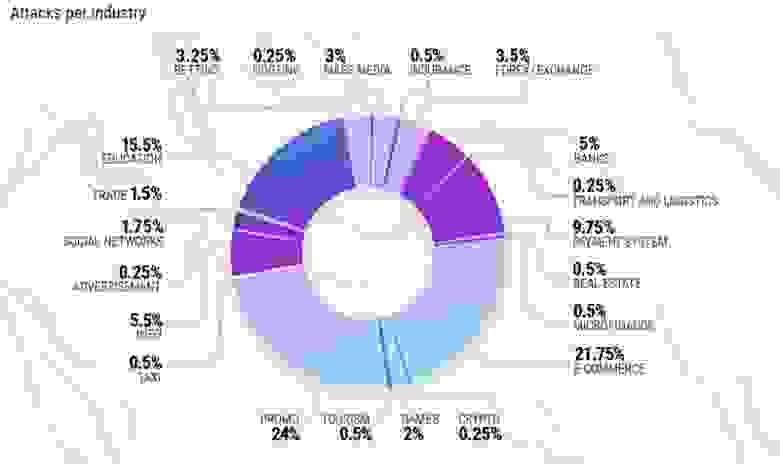
In Q4 2021, the most attacked industry with a significant outrunning was E-commerce, which amassed 21.75% of all attacks. The Education industry follows it with 15.5% of mitigated attacks and Payment systems with 9.75%. Banks that were in the focus of attacks in Q3 with 22.28% are now targeted by only 5% of the attacks.
The Promo segment had the most extensive attack percentage. Still, as we mentioned in the previous reports, it is hard to differentiate promo pages by the industry, as they are usually cross-segment. We tend to leave them out of evaluation.

The largest botnet in Q4 2021 counted 160 097 devices — almost three times that compared with Q3 and more than in any other quarter of the year 2021.

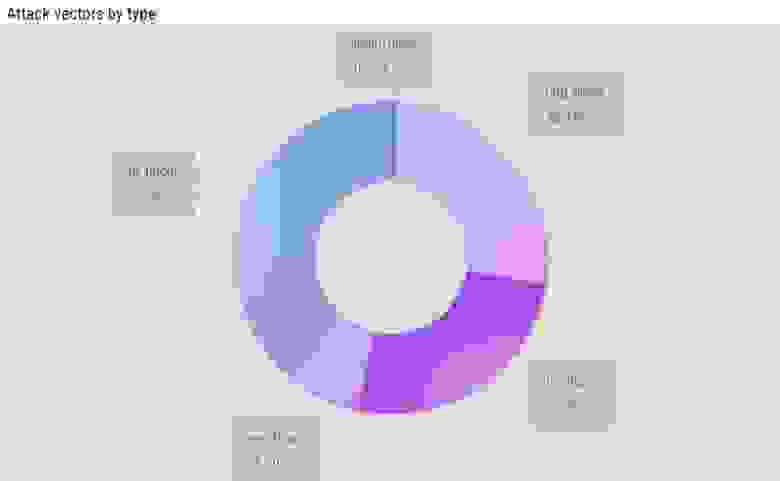
In Q3, we first attempted to categorize application layer, or L7, DDoS attacks.
Same as in Q3, in Q4, the biggest category is Broken HTTP semantics. «Broken» means different deviations from the usual or expected user’s behaviour, with almost a third of all attacks — 32.38%.
Request Rate Patterns include everything that stands out from what is expected from a legitimate user in terms of request rate analogically to the previous category and collected 28.58% of Q3 application-layer attacks.
That differs from the third category of Abnormal URL traversal, which is precisely what it sounds like — an action that a legitimate user often doesn’t even have the ability to make, where we saw 12.68% of attack data.
Combined, those top three categories are responsible for 73.64% of the L7 attacks, with 15.21% in Multiple Matched Criteria, where we put all concurrent attacks.


In Q4 2021, we saw a record-high number of unique hijacking ASes — during November, 17 798 autonomous systems generated BGP hijacks. According to IANA’s statistics, let’s take the number of allocated ASNs as 109 246. That means that in November 2021, 16.3% of all ASNs in the world originated at most minuscule one BGP hijack. That is insane, considering ROA — RPKI adoption and the global movement towards the total elimination of BGP hijacks.
At the beginning of 2022, Qrator.Radar estimates the number of active ASes at 79657 (according to CIDR report data). If that number is correct, then the percentage of hijackers is 22.3% from all active ASes globally.
And the bad news doesn’t end here.

Another BGP «record» was made in the number of BGP route leaks during a month. Here we count the total number and not the unique routing incidents — if one AS originates a route leak, that is distinguished as a separate one by the Qrator.Radar model — we count it in.
So, December 2021 showed a record-high number of route leaks — more than ten million! That’s a staggering number, almost twice as large as it used to be in the first two months of Q4.
And the quarterly total route leaks in Q4 are more than twice as they were in Q3 — 19 852 504 in Q4 vs 7 589 347 in Q3.
Now, let us look at the global incidents that are part of these statistics through each month of the quarter.
Reminder note: Qrator.Radar team has a set of certain thresholds that separate global incidents from the rest. They include affected prefixes, affected autonomous systems, and the incident’s distribution among routing tables.
Global BGP Route Leaks in Q4 2021:
October: 0
November: 0
December: 4
A detailed description of these incidents could be found according to the occurrence date in the Qrator.Radar Twitter feed.
Global BGP Hijacks in Q4 2021:
October: 3
November: 0
December: 0
Data sources and observation methodology
Qrator Labs' Quarterly and Annual Reports are based on the data from observed attacks on web pages and servers under the Qrator Labs' DDoS attacks mitigation service and customers insights on the mitigated attacks. The figures and data were collected according to the report’s scope timeframe, i.e., a specific calendar quarter or calendar year.
Each report consists only of the attack data Qrator Labs directly observed («mitigated»). Qrator Labs does not collect or analyze traffic outside of its network, meaning that all the conclusions we draw are based solely on the data passing through the Qrator BGP anycast network. By 2021 Qrator Labs anycast network exceeds 3 Tbps of filtering capacity built upon 14 points-of-presence, each connected to a Tier-1 ISP.
Qrator.Radar analyzes BGP paths data collected from more than 800 sessions, serving analytics and real-time incident monitoring to the registered and authenticated owners of Autonomous Systems. Qrator.Radar provides a user with historical data on AS connectivity (links), BGP routing anomalies, and network-related security issues.
Qrator.Radar is the BGP monitoring and analytics tool, as well as the vulnerability scanner for known networks.
That means that when scanning a network, Qrator.Radar analyzes the presence of any known amplificators and the amplification (https://en.wikipedia.org/wiki/Denial-of-service_attack#Amplification) factor itself. This data is further processed to give ISP (or, more precisely, ASN) owners the possibility to analyze the availability of any of those services, which attackers could exploit for DDoS attacks.
Such scans are not harmful in any way to the company’s hardware or software, Qrator.Radar collects the data only to notify the rightful owners of the network of when and which amplificators became available within the networks they manage. We require authorization from the ASN owners before showing this kind of information we consider sensitive.
Besides the network data and its analysis Qrator Labs also employs open-source intelligence analysis within the public reports. Qrator.Radar, in turn, uses data from publicly available databases to get the IRR, RPKI and geolocation information to correlate between own and open-sourced data.
