Мониторинг NetApp Volumes через HTTP

Всем привет. В продолжение прошлой статьи, связанной с костылями и SSH для мониторинга места и метрик производительности доступных нам томов на NetApp, хочу поделиться и описать более правильный способ мониторинга через ONTAP REST API с помощью Zabbix HTTP-agent. Так как мы арендуем только место, то единственное, что можем полезного для себя вытащить — это метрики производительности, использования места и статусы томов по разным показаниям.
Общая информация и создание мастер-элементов
Нам необходимо создать несколько мастер-элементов, которые мы будем парсить и использовать для низкоуровневого обнаружения. Есть два мастер-элемента, из которых будем получать нужную нам информацию:
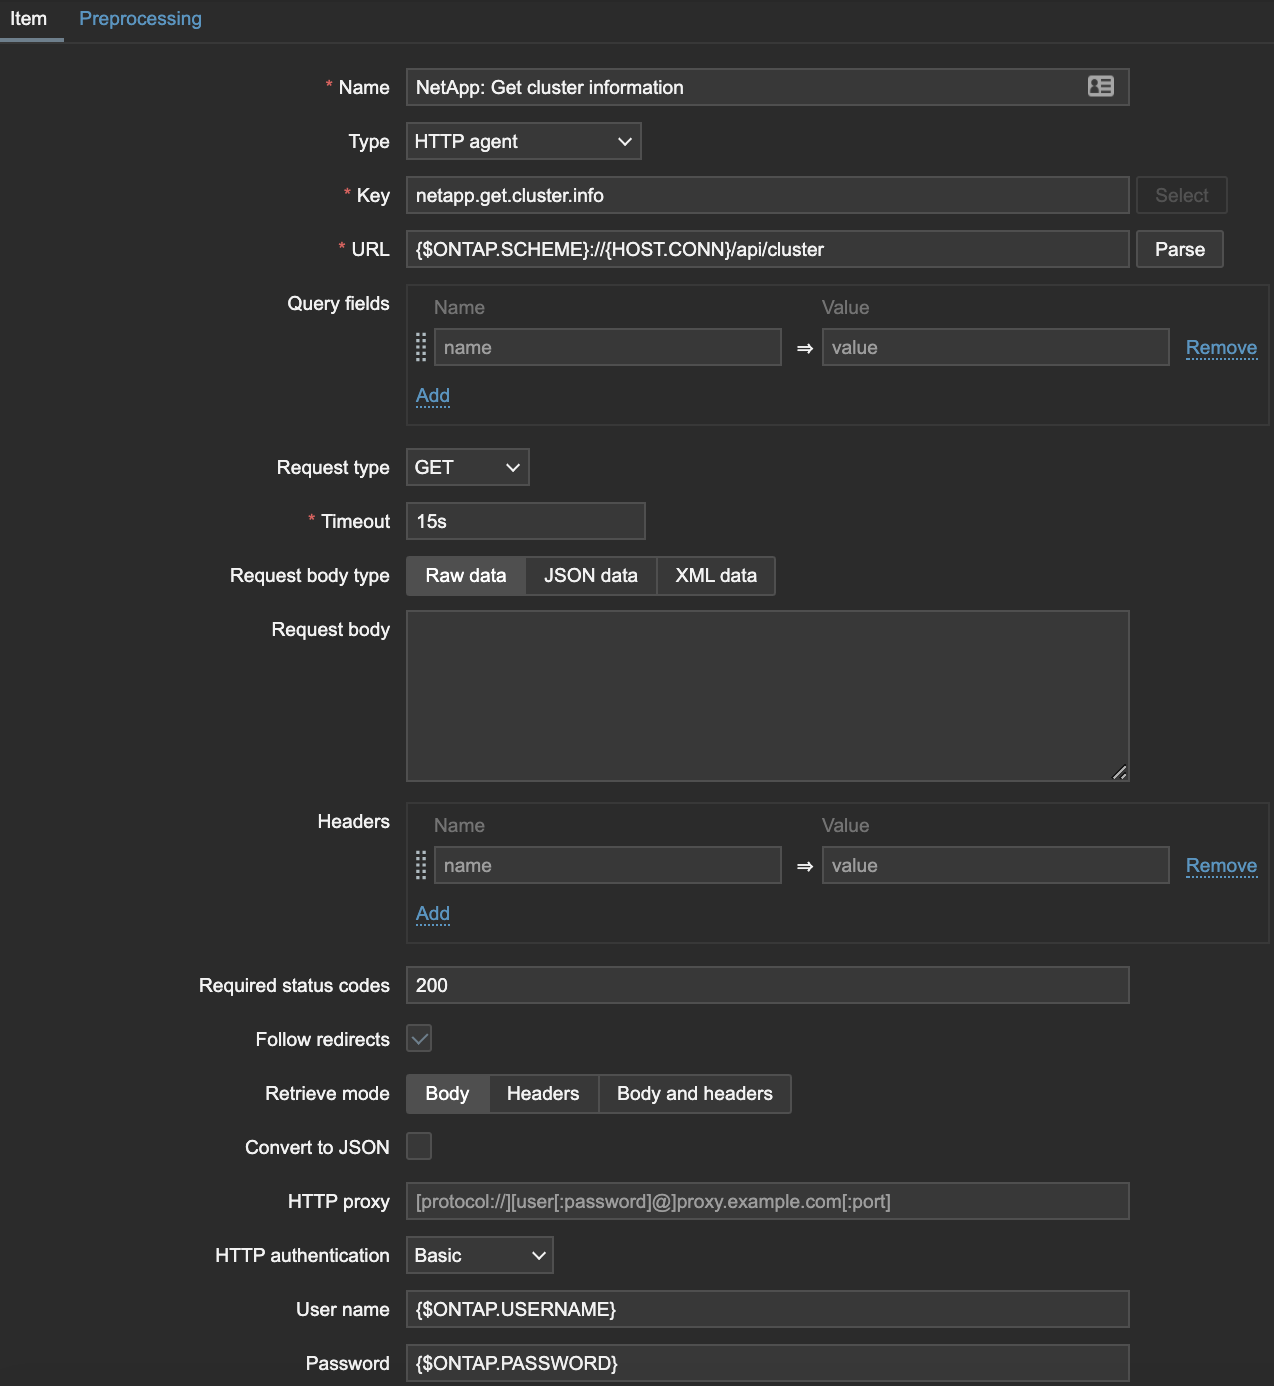
NetApp: Get cluster information — данные забираются через API по ссылке {$ONTAP.SCHEME}://{HOST.CONN}/api/cluster, где:
{$ONTAP.SCHEME}— HTTPS;{HOST.CONN}— IP NetApp;{$ONTAP.USERNAME}— пользователь от NetApp;{$ONTAP.PASSWORD}— пароль от NetApp.
{
  "name": "NETAPP_NAME",
  "uuid": "e58448eb-39ac-11e8-ba6a-00a098d57984",
  "version": {
    "full": "NetApp Release 9.6P10: Thu Aug 20 19:45:05 UTC 2020",
    "generation": 9,
    "major": 6,
    "minor": 0
  },
  "_links": {
    "self": {
      "href": "/api/cluster"
    }
  }
}
NetApp: Get volumes — данные забираются через API по ссылке {$ONTAP.SCHEME}://{HOST.CONN}/api/storage/volumes, там очень много томов (124), поэтому для наглядности урезал их до четырёх.
{
  "records": [
    {
      "uuid": "04dd9e6a-d04f-49d8-8999-97572ed9183c",
      "name": "data_1",
      "_links": {
        "self": {
          "href": "/api/storage/volumes/04dd9e6a-d04f-49d8-8999-97572ed9183c"
        }
      }
    },
    {
      "uuid": "0638aa9e-d683-43a7-bb75-7f056876a6cb",
      "name": "data_2",
      "_links": {
        "self": {
          "href": "/api/storage/volumes/0638aa9e-d683-43a7-bb75-7f056876a6cb"
        }
      }
    },
    {
      "uuid": "0672d0de-e3b0-47e5-9d4a-4e3ae1d34e51",
      "name": "data_3",
      "_links": {
        "self": {
          "href": "/api/storage/volumes/0672d0de-e3b0-47e5-9d4a-4e3ae1d34e51"
        }
      }
    },
    {
      "uuid": "06b8a873-6d85-49f2-bf83-55daf31b26e7",
      "name": "data_4",
      "_links": {
        "self": {
          "href": "/api/storage/volumes/06b8a873-6d85-49f2-bf83-55daf31b26e7"
        }
      }
    }
  ],
  "num_records": 124,
  "_links": {
    "self": {
      "href": "/api/storage/volumes"
    }
  }
}
Элементы данных и низкоуровневое обнаружение
NetApp: Get cluster information — отсюда нам нужна только версия, чтобы отслеживать обновления прошивки.
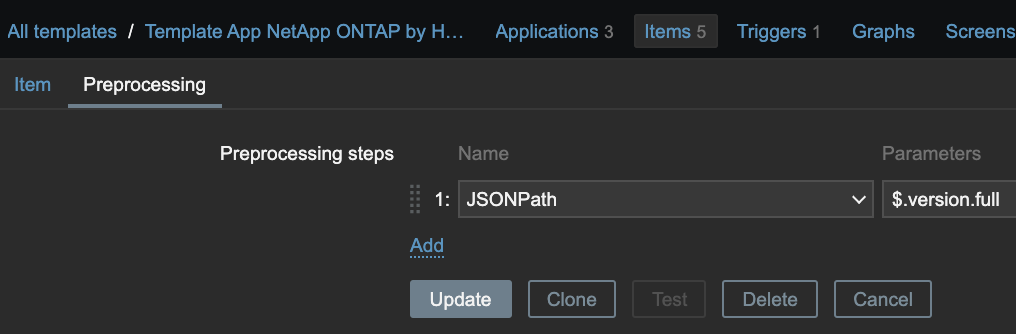 Используем препроцессинг JSONPath.
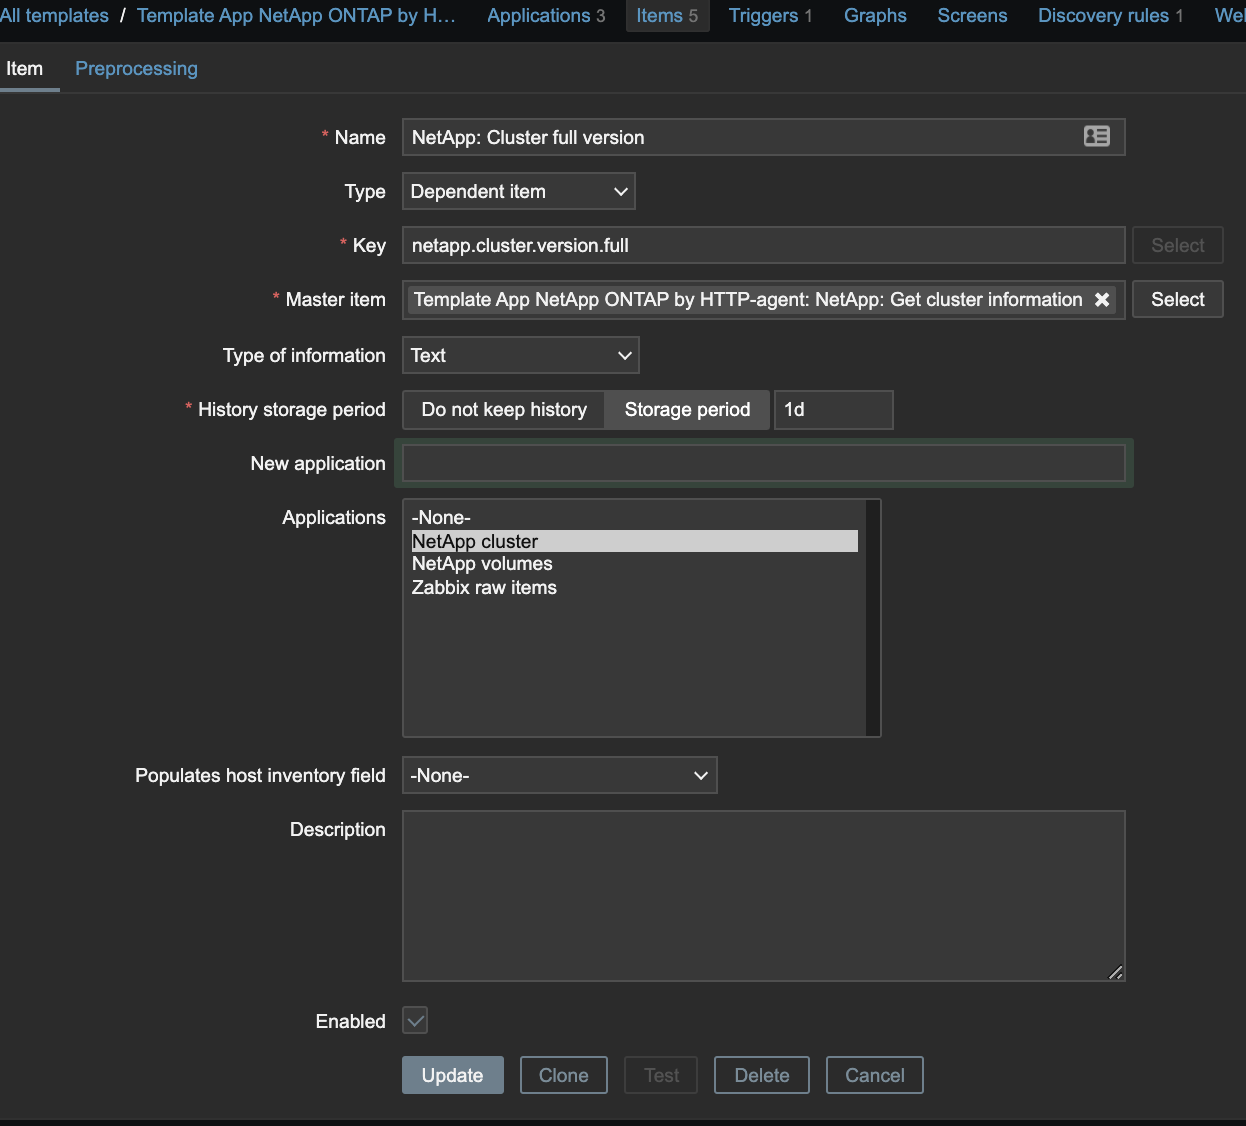
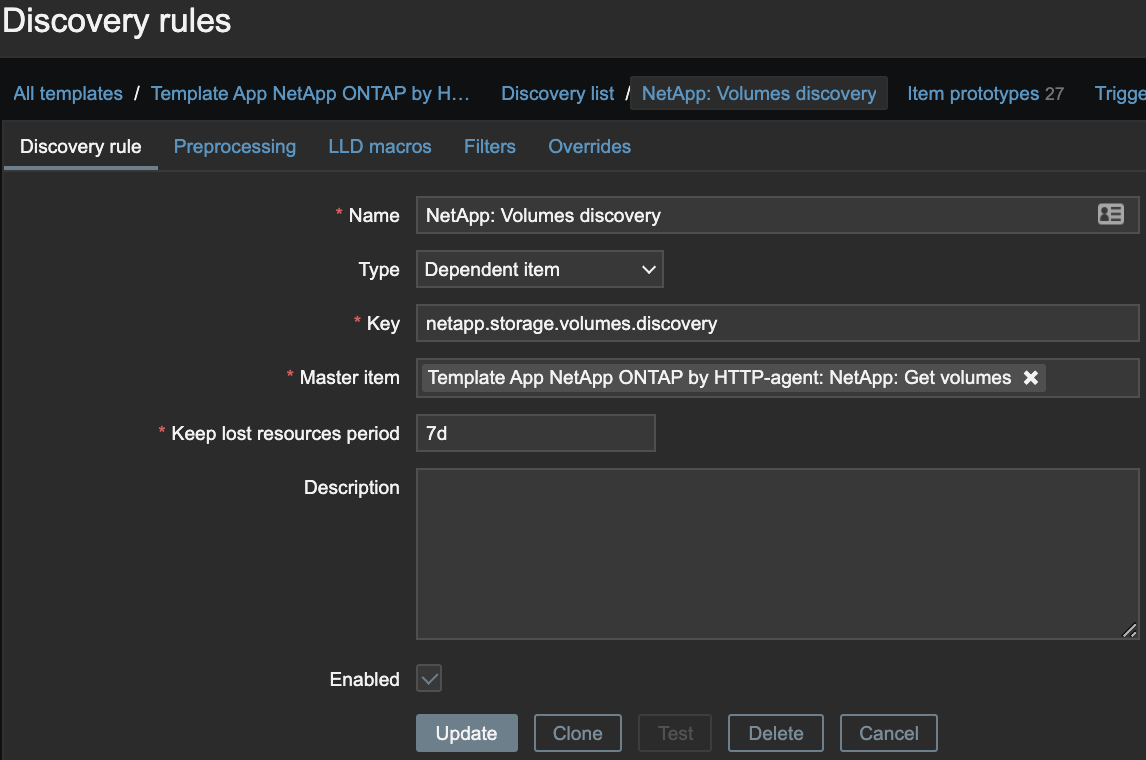
NetApp: Get volumes — на основе этой информации нам необходимо сделать низкоуровневое обнаружение и создать два макроса:
{#VOLUME_NAME}— название тома;{#VOLUME_UUID}— UUID тома, будет ипользоваться для сбора статистики по каждому тому.
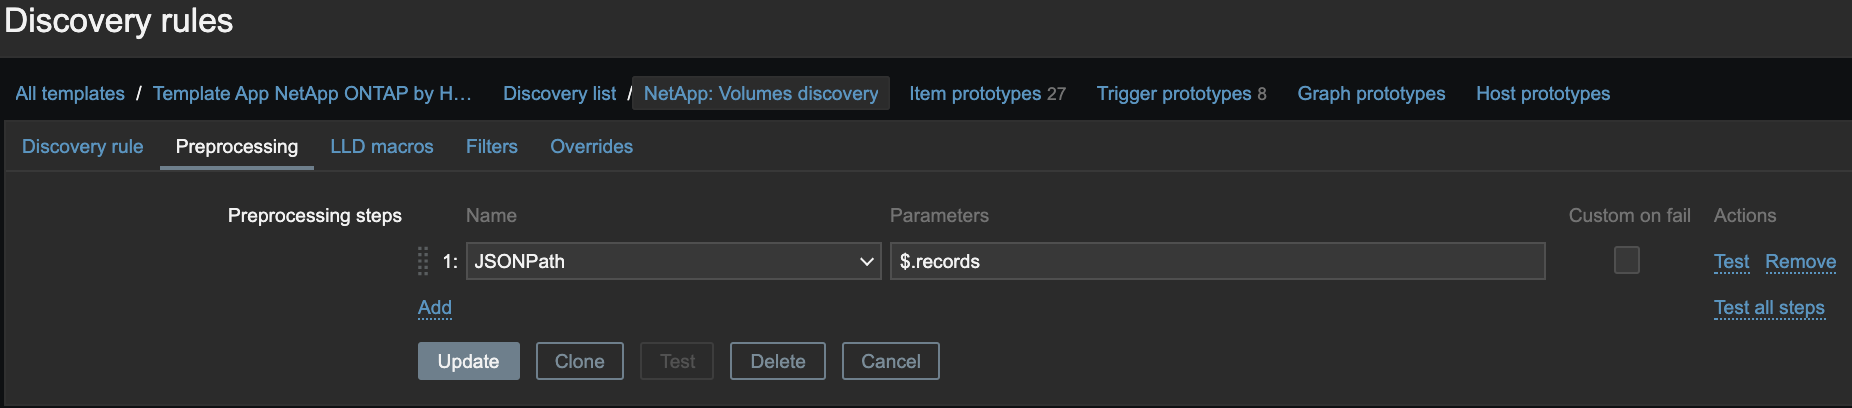 Используем препроцессинг JSONPath.
Для автоматического создания элементов данных необходимо сделать два прототипа мастер-элементов данных.
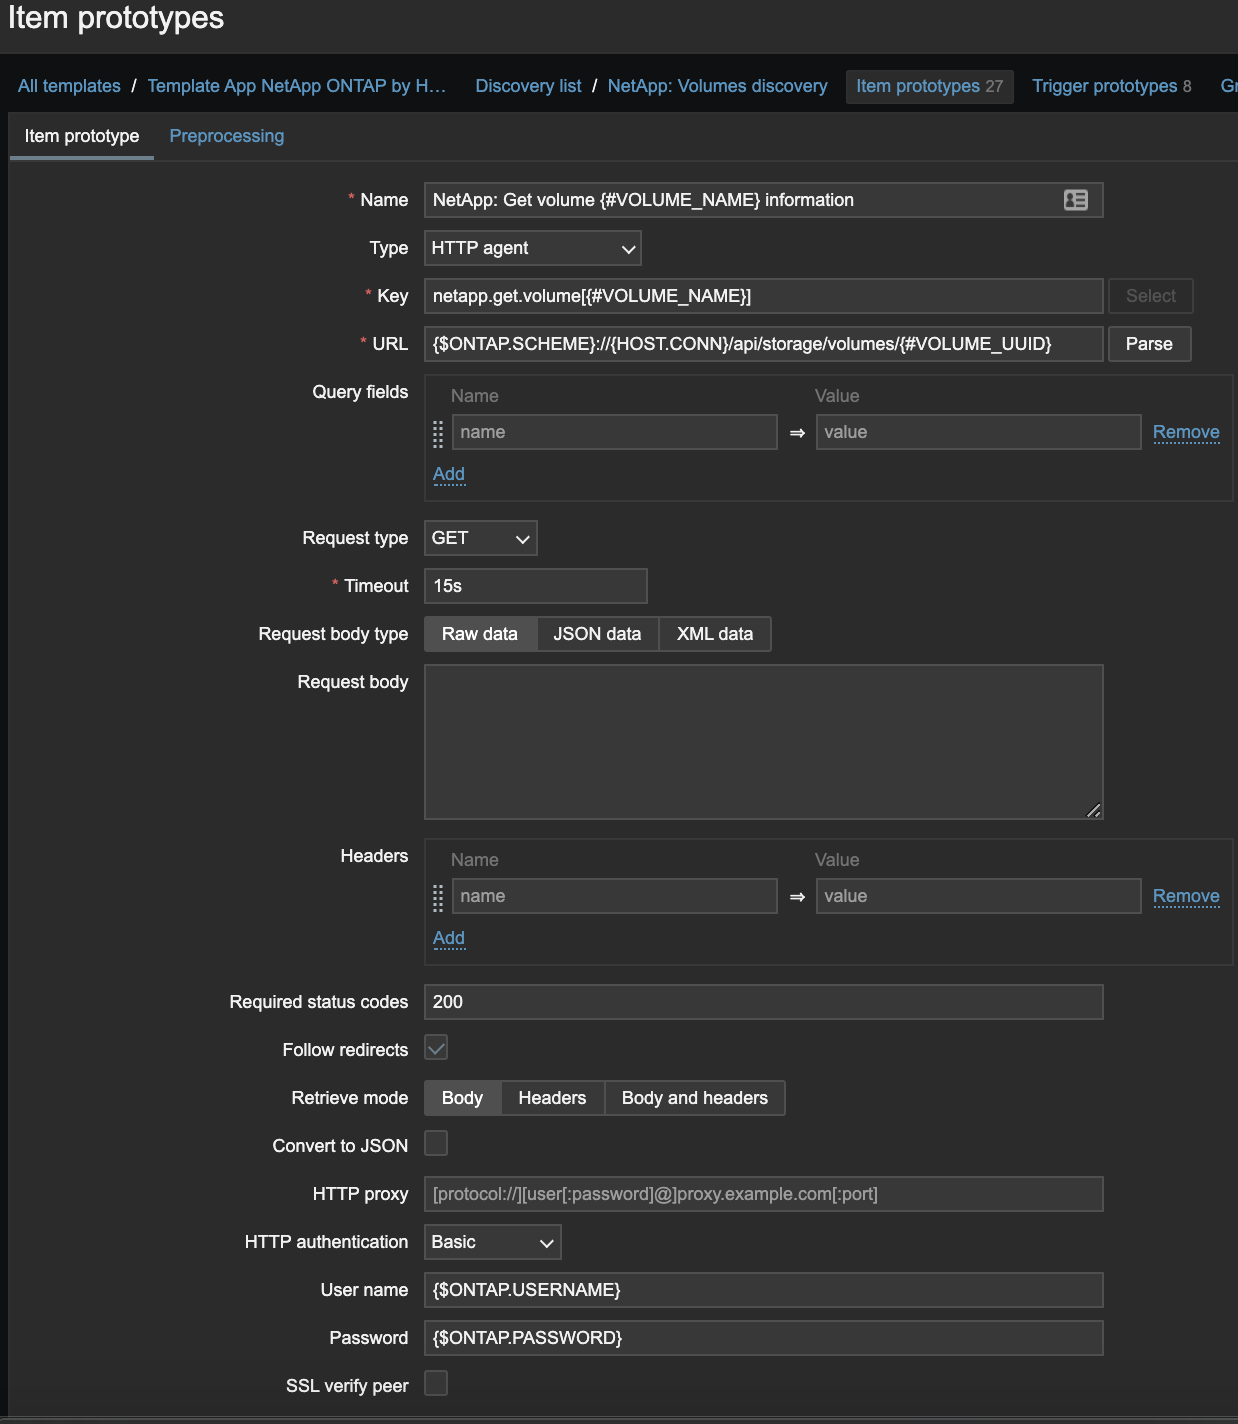
NetApp: Get volume {#VOLUME_NAME} information — получаем нужную нам информацию о томе через API по ссылке {$ONTAP.SCHEME}://{HOST.CONN}/api/storage/volumes/{#VOLUME_UUID}.
{
  "uuid": "a1ef1dd3-bf62-470c-87d0-39d0c4366913",
  "comment": "",
  "create_time": "2018-10-10T15:44:42+03:00",
  "language": "c.utf_8",
  "name": "data_1",
  "size": 265106042880,
  "state": "online",
  "style": "flexvol",
  "tiering": {
    "policy": "none"
  },
  "type": "rw",
  "aggregates": [
    {
      "name": "DC_AFF300_03",
      "uuid": "a9e28005-e099-4fcc-bcaa-6781c0086e0b"
    }
  ],
  "clone": {
    "is_flexclone": false
  },
  "nas": {
    "export_policy": {
      "name": "default"
    }
  },
  "snapshot_policy": {
    "name": "DOMCLICK_daily"
  },
  "svm": {
    "name": "DOMCLIC_SVM",
    "uuid": "46a00e5d-c22d-11e8-b6ed-00a098d48e6d"
  },
  "space": {
    "size": 265106042880,
    "available": 62382796800,
    "used": 189467947008
  },
  "metric": {
    "timestamp": "2021-02-16T12:42:00Z",
    "duration": "PT15S",
    "status": "ok",
    "latency": {
      "other": 175,
      "total": 183,
      "read": 515,
      "write": 323
    },
    "iops": {
      "read": 41,
      "write": 15,
      "other": 2006,
      "total": 2063
    },
    "throughput": {
      "read": 374272,
      "write": 78948,
      "other": 0,
      "total": 453220
    }
  },
  "_links": {
    "self": {
      "href": "/api/storage/volumes/a1ef1dd3-bf62-470c-87d0-39d0c4366913"
    }
  }
}
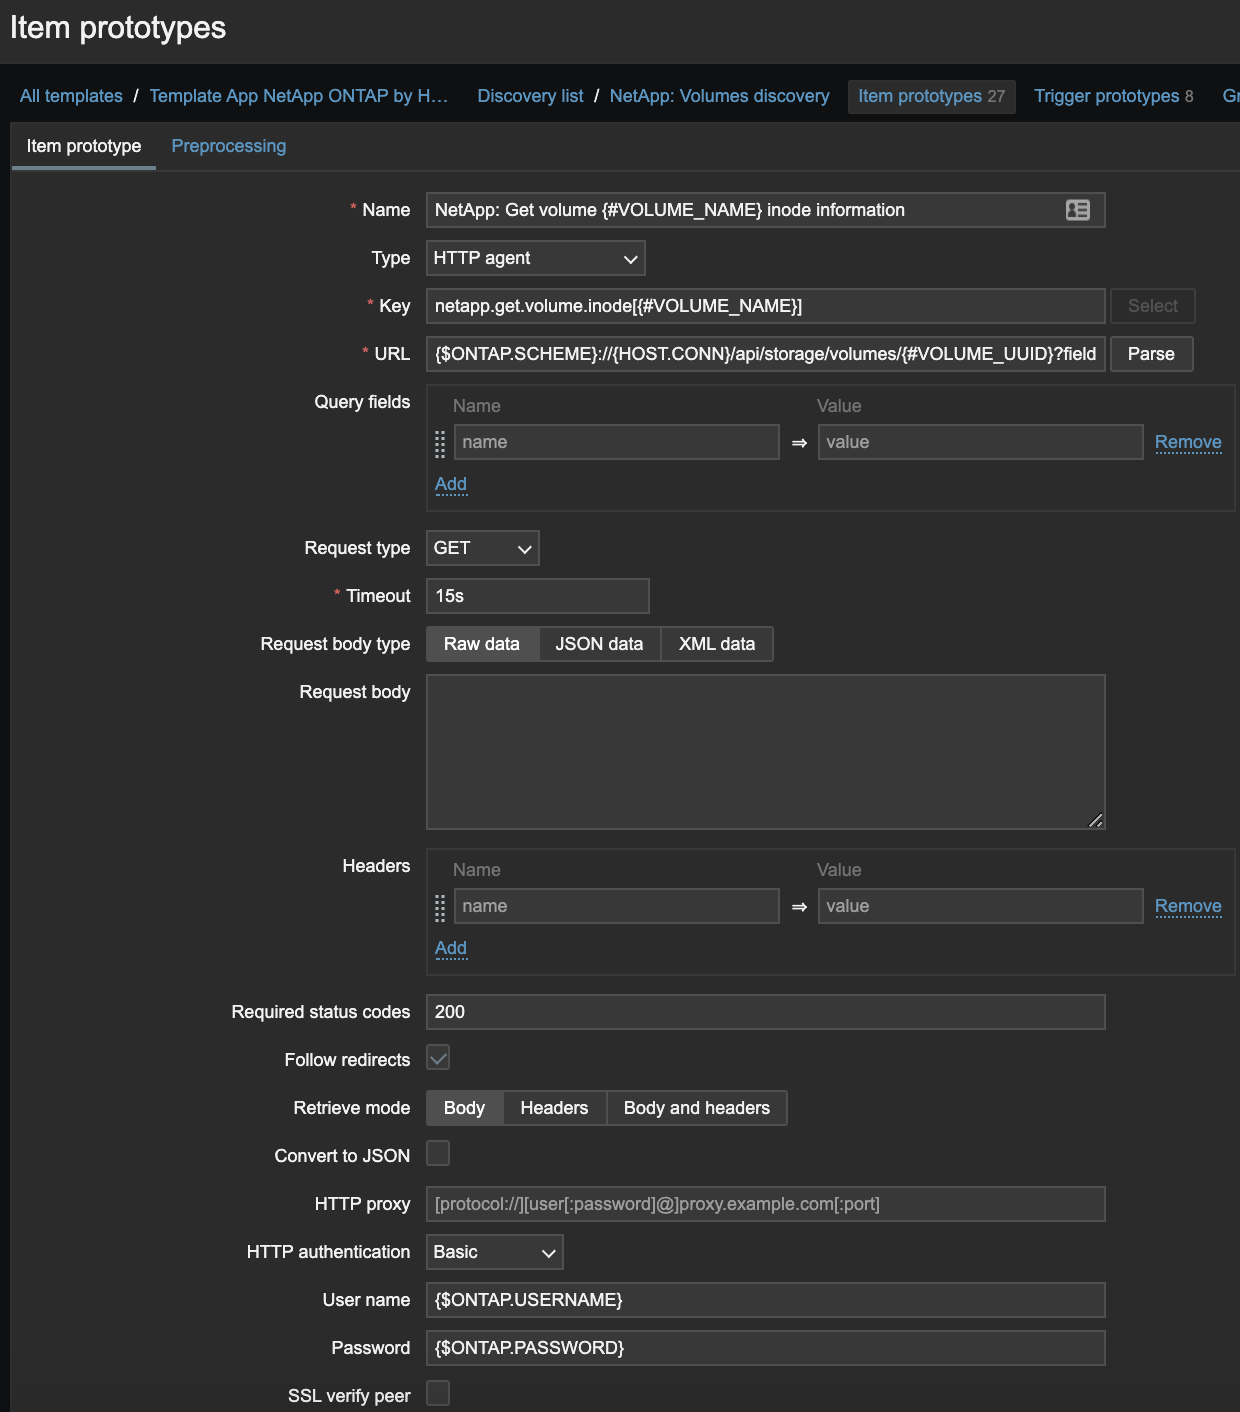
NetApp: Get volume {#VOLUME_NAME} inode information — получаем информацию об использовании инод в каждом томе через API по ссылке {$ONTAP.SCHEME}://{HOST.CONN}/api/storage/volumes/{#VOLUME_UUID}?fields=files.
{
  "uuid": "a1ef1dd3-bf62-470c-87d0-39d0c4366913",
  "name": "data_1",
  "files": {
    "maximum": 7685871,
    "used": 4108317
  },
  "_links": {
    "self": {
      "href": "/api/storage/volumes/a1ef1dd3-bf62-470c-87d0-39d0c4366913"
    }
  }
}
Зависимые элементы
Выше мы получили несколько мастер-элементов с JSON’ом внутри, теперь их можно с легкостью распарсить с помощью JSONPath и вытащить необходимые нам метрики. Разберу один пример и дальше просто опишу, какие метрики собираем.
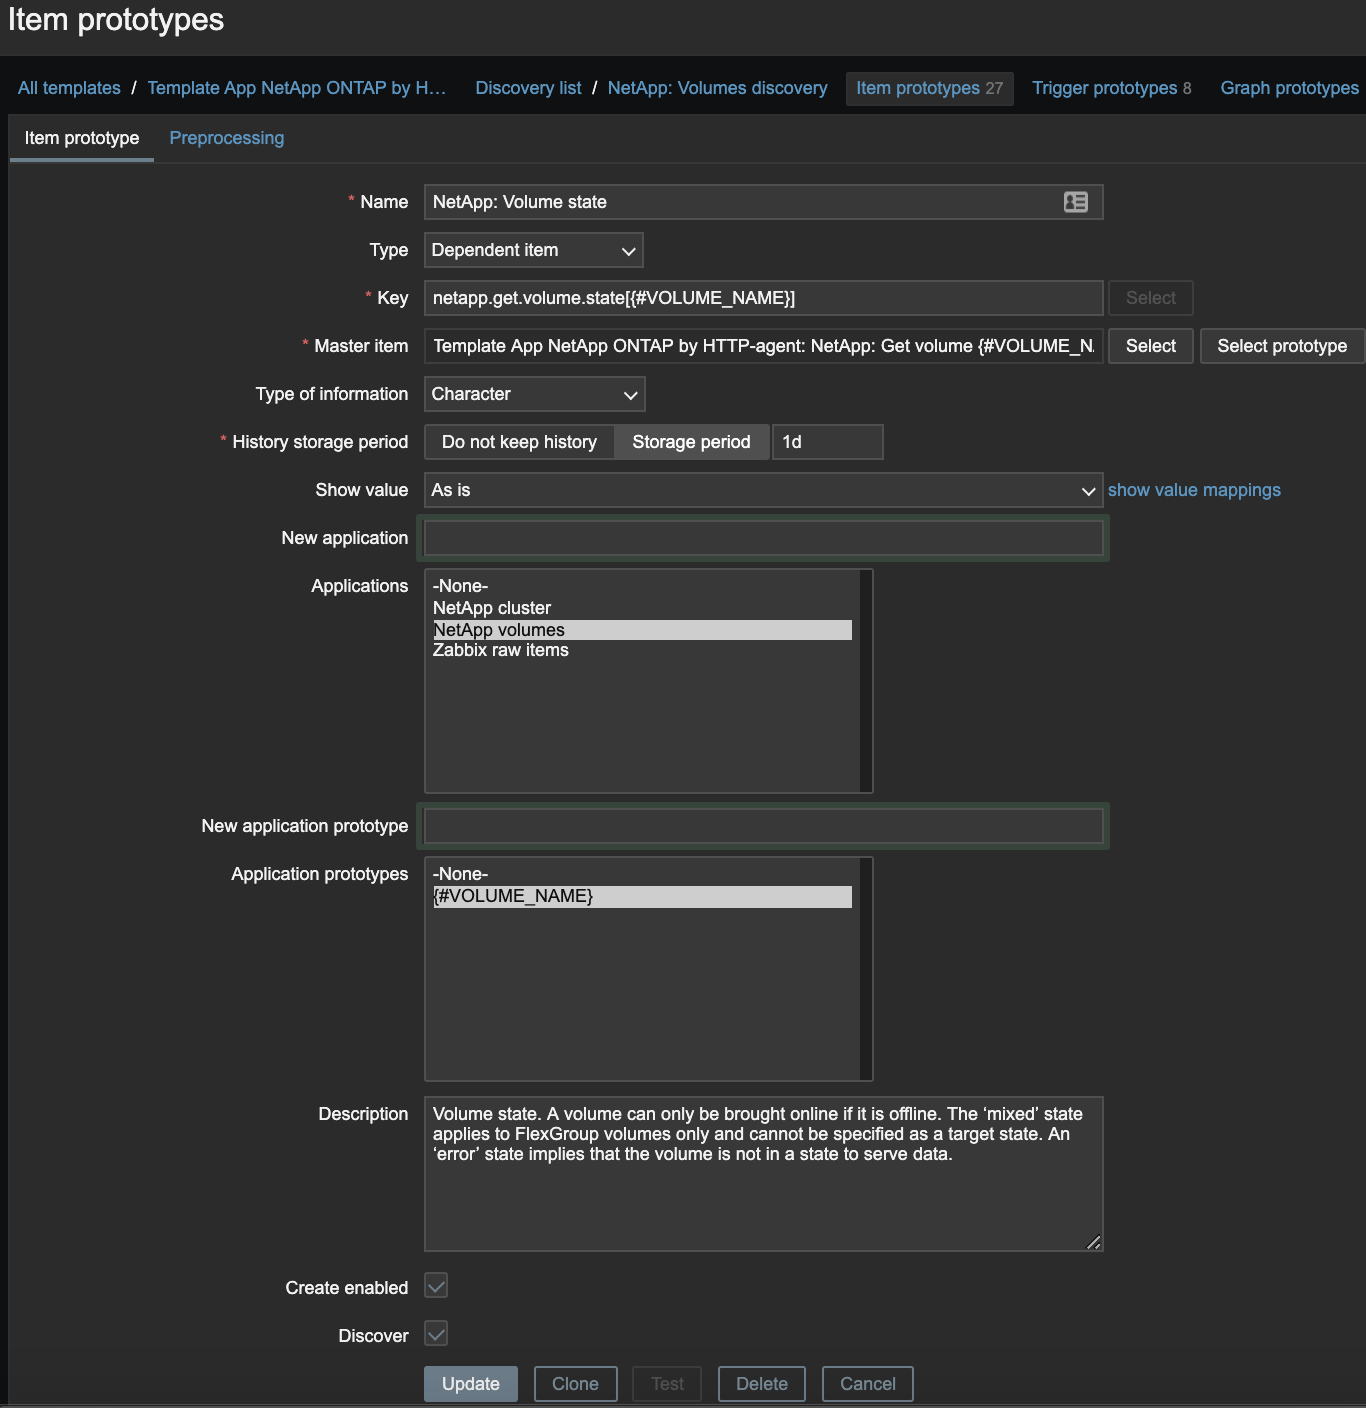
NetApp: Volume state — состояние тома, парсим мастер-элемент NetApp: Get volume {#VOLUME_NAME} information.
NetApp: Get volume data_1 information{
"uuid": "a1ef1dd3-bf62-470c-87d0-39d0c4366913",
"comment": "",
"create_time": "2018-10-10T15:44:42+03:00",
"language": "c.utf_8",
"name": "data_1",
"size": 265106042880,
"state": "online",
"style": "flexvol",
"tiering": {
"policy": "none"
},
"type": "rw",
"aggregates": [
{
"name": "DC_AFF300_03",
"uuid": "a9e28005-e099-4fcc-bcaa-6781c0086e0b"
}
],
"clone": {
"is_flexclone": false
},
"nas": {
"export_policy": {
"name": "default"
}
},
"snapshot_policy": {
"name": "DOMCLICK_daily"
},
"svm": {
"name": "DOMCLIC_SVM",
"uuid": "46a00e5d-c22d-11e8-b6ed-00a098d48e6d"
},
"space": {
"size": 265106042880,
"available": 62382796800,
"used": 189467947008
},
"metric": {
"timestamp": "2021-02-16T12:42:00Z",
"duration": "PT15S",
"status": "ok",
"latency": {
"other": 175,
"total": 183,
"read": 515,
"write": 323
},
"iops": {
"read": 41,
"write": 15,
"other": 2006,
"total": 2063
},
"throughput": {
"read": 374272,
"write": 78948,
"other": 0,
"total": 453220
}
},
"_links": {
"self": {
"href": "/api/storage/volumes/a1ef1dd3-bf62-470c-87d0-39d0c4366913"
}
}
}
 Используем препроцессинг JSONPath.
Собственно, всё выдергивание нужных метрик выглядит аналогично.
Состояния томов
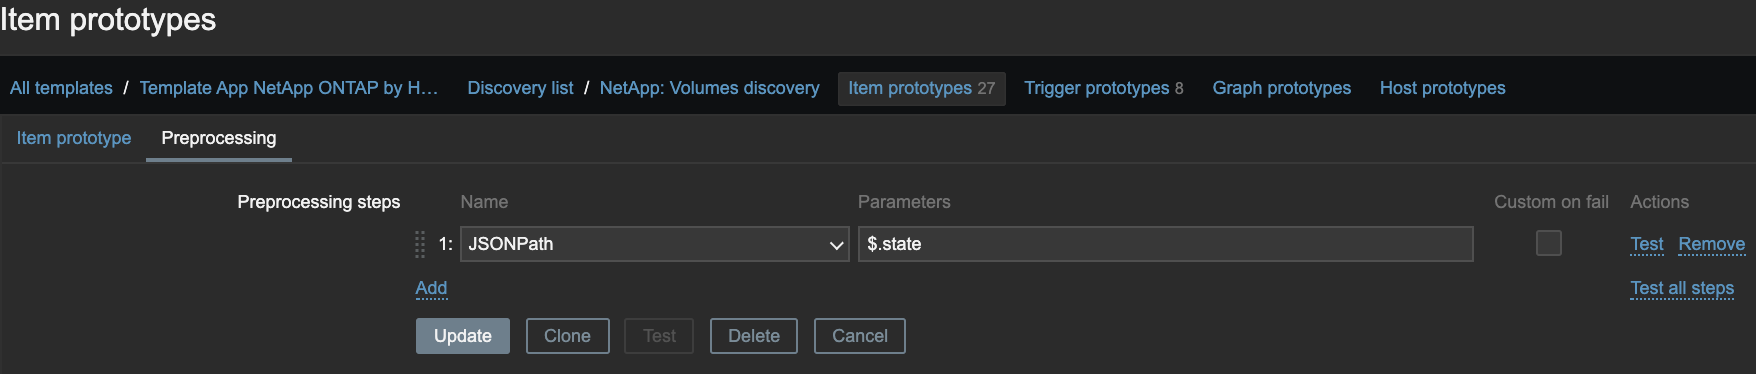
Volume state — состояние тома. Этапы предварительной обработки: JSONPath: $.state
Volume state. A volume can only be brought online if it is offline. The «mixed» state applies to FlexGroup volumes only and cannot be specified as a target state. An «error» state implies that the volume is not in a state to serve data.
Type of the volume — тип тома. Этапы предварительной обработки: JSONPath: $.type
Type of the volume.
rw ‐ read-write volume.
dp ‐ data-protection volume.
ls ‐ load-sharing dp volume. Valid in GET.
Style of the volume — стиль тома. Этапы предварительной обработки: JSONPath: $.style
The style of the volume. If «style» is not specified, the volume type is determined based on the specified aggregates. Specifying a single aggregate, without «constituents_per_aggregate» creates a flexible volume. Specifying multiple aggregates, or a single aggregate with «constituents_per_aggregate» creates a FlexGroup. If «style» is specified, a volume of that type is created. That is, if style is «flexvol», a single aggregate must be specified. If style is «flexgroup», the system either uses the specified aggregates, or automatically provisions if no aggregates are specified.
flexvol ‐ flexible volumes and FlexClone volumes
flexgroup ‐ FlexGroups.
Volume metrics status — статус показателей тома. Этапы предварительной обработки: JSONPath: $.metric.status
Any errors associated with the sample. For example, if the aggregation of data over multiple nodes fails then any of the partial errors might be returned, «ok» on success, or «error» on any internal uncategorized failure. Whenever a sample collection is missed but done at a later time, it is back filled to the previous 15 second timestamp and tagged with «backfilled_data». «Inconsistent_delta_time» is encountered when the time between two collections is not the same for all nodes. Therefore, the aggregated value might be over or under inflated. «Negative_delta» is returned when an expected monotonically increasing value has decreased in value. «Inconsistent_old_data» is returned when one or more nodes does not have the latest data.
Comment on the volume — комментарий к тому. Этапы предварительной обработки: JSONPath: $.comment
A comment for the volume. Valid in POST or PATCH.
Использование дискового пространства
Volume space used — использовано пространства. Этапы предварительной обработки: JSONPath: $.space.used
The virtual space used (includes volume reserves) before storage efficiency, in bytes.
Volume space size — выделено пространства. Этапы предварительной обработки: JSONPath: $.space.size
Total provisioned size. The default size is equal to the minimum size of 20MB, in bytes.
Volume space available — доступно пространства. Этапы предварительной обработки: JSONPath: $.space.available
The available space, in bytes.
Volume space used in percentage — использовано пространства в процентах, применяется в триггерах и для дэшборда. Вычисляется как (last(netapp.get.volume.space.used[{#VOLUME_NAME}])*100)/last(netapp.get.volume.space.size[{#VOLUME_NAME}])
Метрики производительности томов
Пропускная способность
Пропускная способность на объекте хранения, измеряется в байтах в секунду.
Volume throughput write — пропускная способность на запись. Этапы предварительной обработки: JSONPath: $.metric.throughput.write
Peformance metric for write I/O operations.
Volume throughput total — общая пропускная способность. Этапы предварительной обработки: JSONPath: $.metric.throughput.total
Performance metric aggregated over all types of I/O operations.
Volume throughput read — пропускная способность на чтение. Этапы предварительной обработки: JSONPath: $.metric.throughput.read
Performance metric for read I/O operations.
Volume throughput other — пропускная способность для других операций. Этапы предварительной обработки: JSONPath: $.metric.throughput.other
Performance metric for other I/O operations. Other I/O operations can be metadata operations, such as directory lookups and so on.
Задержка операций
Задержка приема-передачи в объекте хранения, измеряется в микросекундах.
Volume latency write in ms — задержка записи в мс. Этапы предварительной обработки: JSONPath: $.metric.latency.write
Peformance metric for write I/O operations.
Volume latency total in ms — общая задержка в мс. Этапы предварительной обработки: JSONPath: $.metric.latency.total
Performance metric aggregated over all types of I/O operations.
Volume latency read in ms — задержка чтения в мс. Этапы предварительной обработки: JSONPath: $.metric.latency.read
Performance metric for read I/O operations.
Volume latency other in ms — задержка для других операций в мс. Этапы предварительной обработки: JSONPath: $.metric.latency.other
Performance metric for other I/O operations. Other I/O operations can be metadata operations, such as directory lookups and so on.
Скорость операций ввода-вывода
Скорость операций ввода-вывода, наблюдаемая на объекте хранения.
Volume iops write — скорость операций ввода-вывода на запись. Этапы предварительной обработки: JSONPath: $.metric.iops.write
Peformance metric for write I/O operations.
Volume iops total — общая скорость операций ввода-вывода. Этапы предварительной обработки: JSONPath: $.metric.iops.total
Performance metric aggregated over all types of I/O operations.
Volume iops read — скорость операций ввода-вывода на чтение. Этапы предварительной обработки: JSONPath: $.metric.iops.read
Performance metric for read I/O operations.
Volume iops other — скорость для других операций ввода-вывода. Этапы предварительной обработки: JSONPath: $.metric.iops.other
Performance metric for other I/O operations. Other I/O operations can be metadata operations, such as directory lookups and so on.
Использование inode
{
  "uuid": "a1ef1dd3-bf62-470c-87d0-39d0c4366913",
  "name": "data_1",
  "files": {
    "maximum": 7685871,
    "used": 4110457
  },
  "_links": {
    "self": {
      "href": "/api/storage/volumes/a1ef1dd3-bf62-470c-87d0-39d0c4366913"
    }
  }
}
Inode used on the volume — использовано инод. Этапы предварительной обработки: JSONPath: $.files.used
Number of files (inodes) used for user-visible data permitted on the volume. This field is valid only when the volume is online.
Inode maximum on the volume — доступно всего инод. Этапы предварительной обработки: JSONPath: $.files.maximum
The maximum number of files (inodes) for user-visible data allowed on the volume. This value can be increased or decreased. Increasing the maximum number of files does not immediately cause additional disk space to be used to track files. Instead, as more files are created on the volume, the system dynamically increases the number of disk blocks that are used to track files. The space assigned to track files is never freed, and this value cannot be decreased below the current number of files that can be tracked within the assigned space for the volume. Valid in PATCH.
Inode available on the volume — свободно инод. Вычисляется как:
last(netapp.get.volume.files.maximum[{#VOLUME_NAME}])-last(netapp.get.volume.files.used[{#VOLUME_NAME}])
Inode used in percentage on the volume — использовано инод в процентах, применяется в триггерах и дэшборде. Вычисляется как: (last(netapp.get.volume.files.used[{#VOLUME_NAME}])*100)/last(netapp.get.volume.files.maximum[{#VOLUME_NAME}])
Оповещения
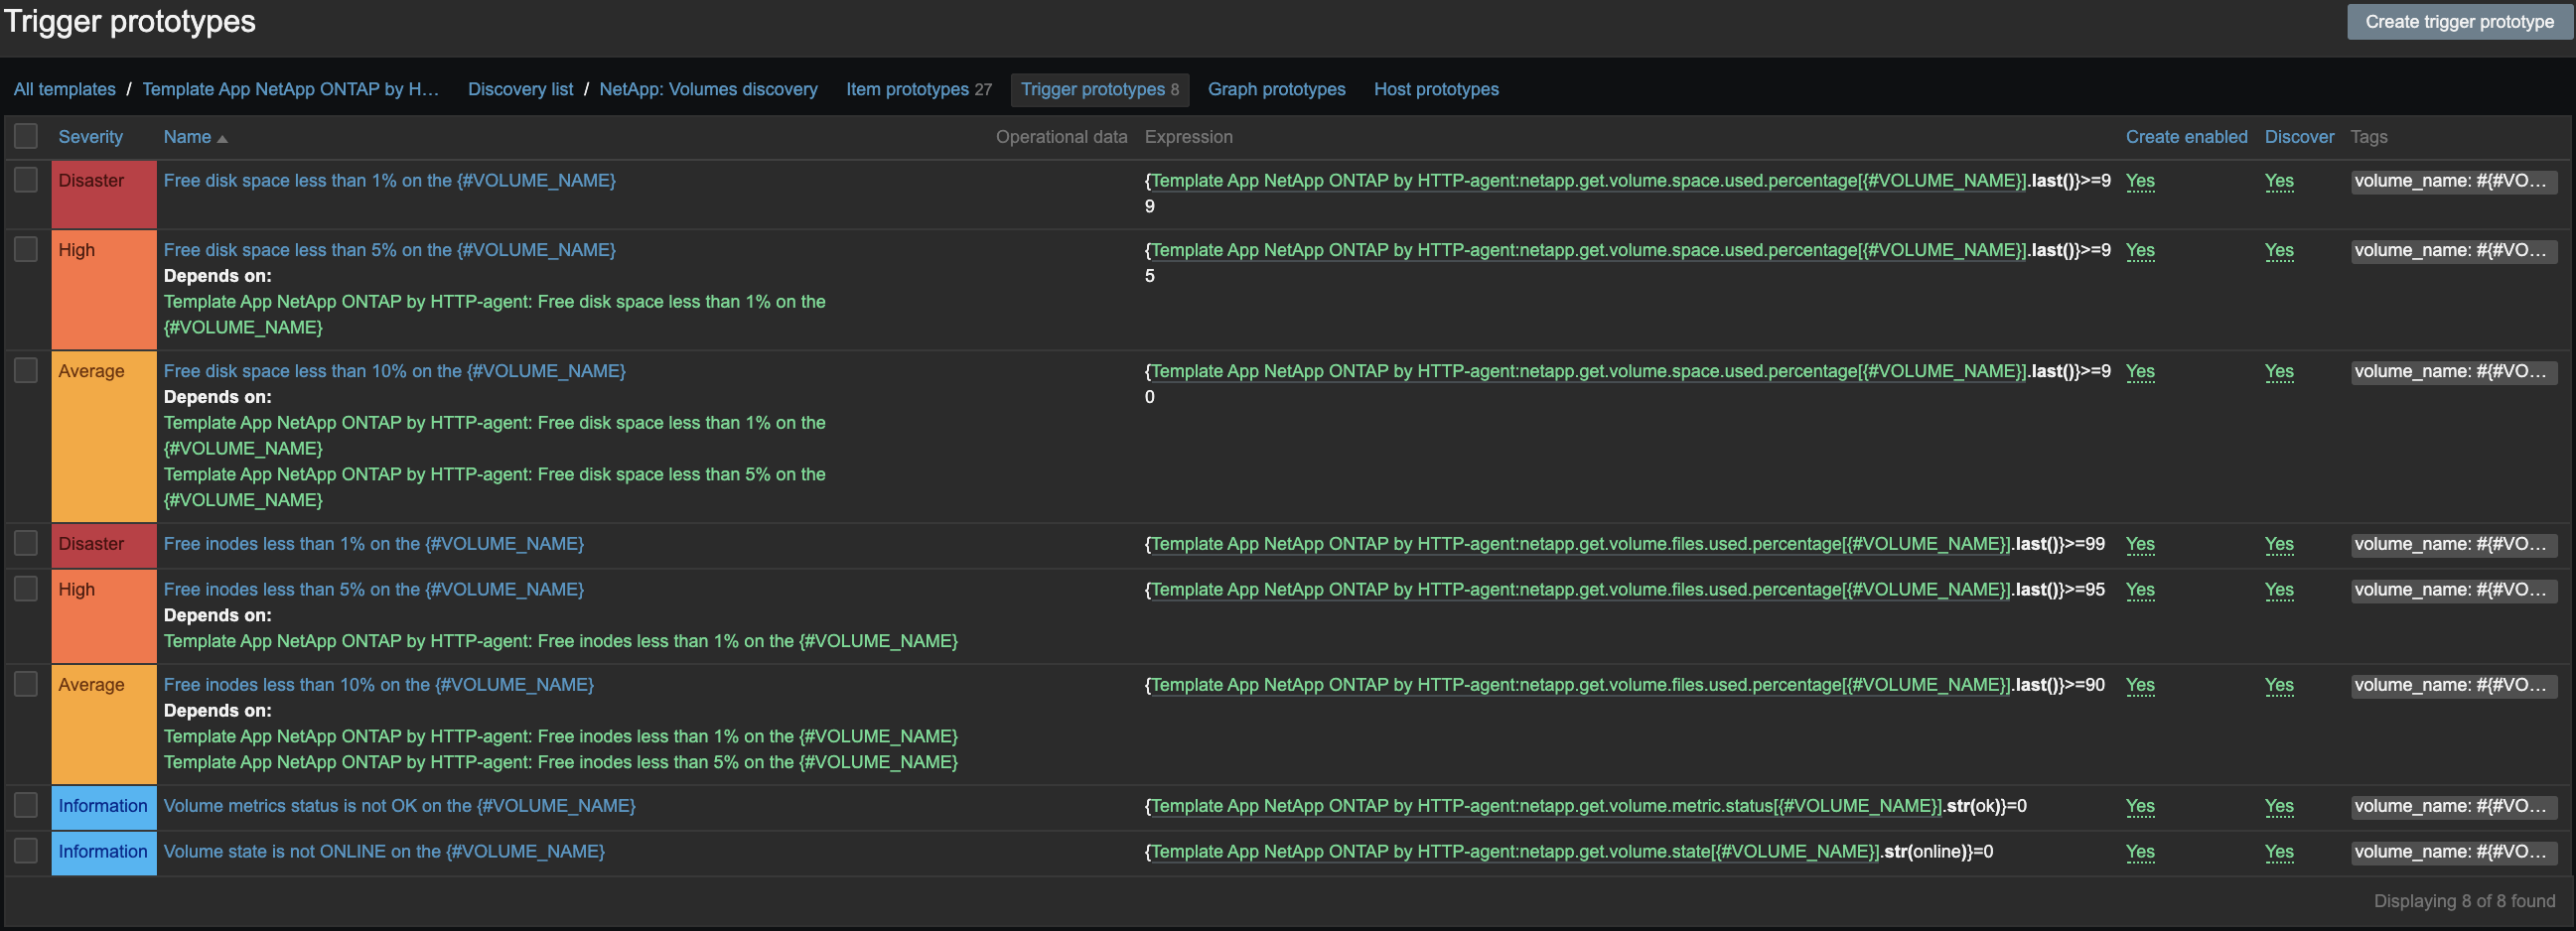
Free disk space less than 1% on the {#VOLUME_NAME}
Free disk space less than 5% on the {#VOLUME_NAME}
Free disk space less than 10% on the {#VOLUME_NAME}
Free inodes less than 1% on the {#VOLUME_NAME}
Free inodes less than 5% on the {#VOLUME_NAME}
Free inodes less than 10% on the {#VOLUME_NAME}
Volume metrics status is not OK on the {#VOLUME_NAME}
Volume state is not ONLINE on the {#VOLUME_NAME}
NetApp cluster version was changed
Визуализация
Дэшбод выглядит практически так же, но стал компактнее и информативнее.
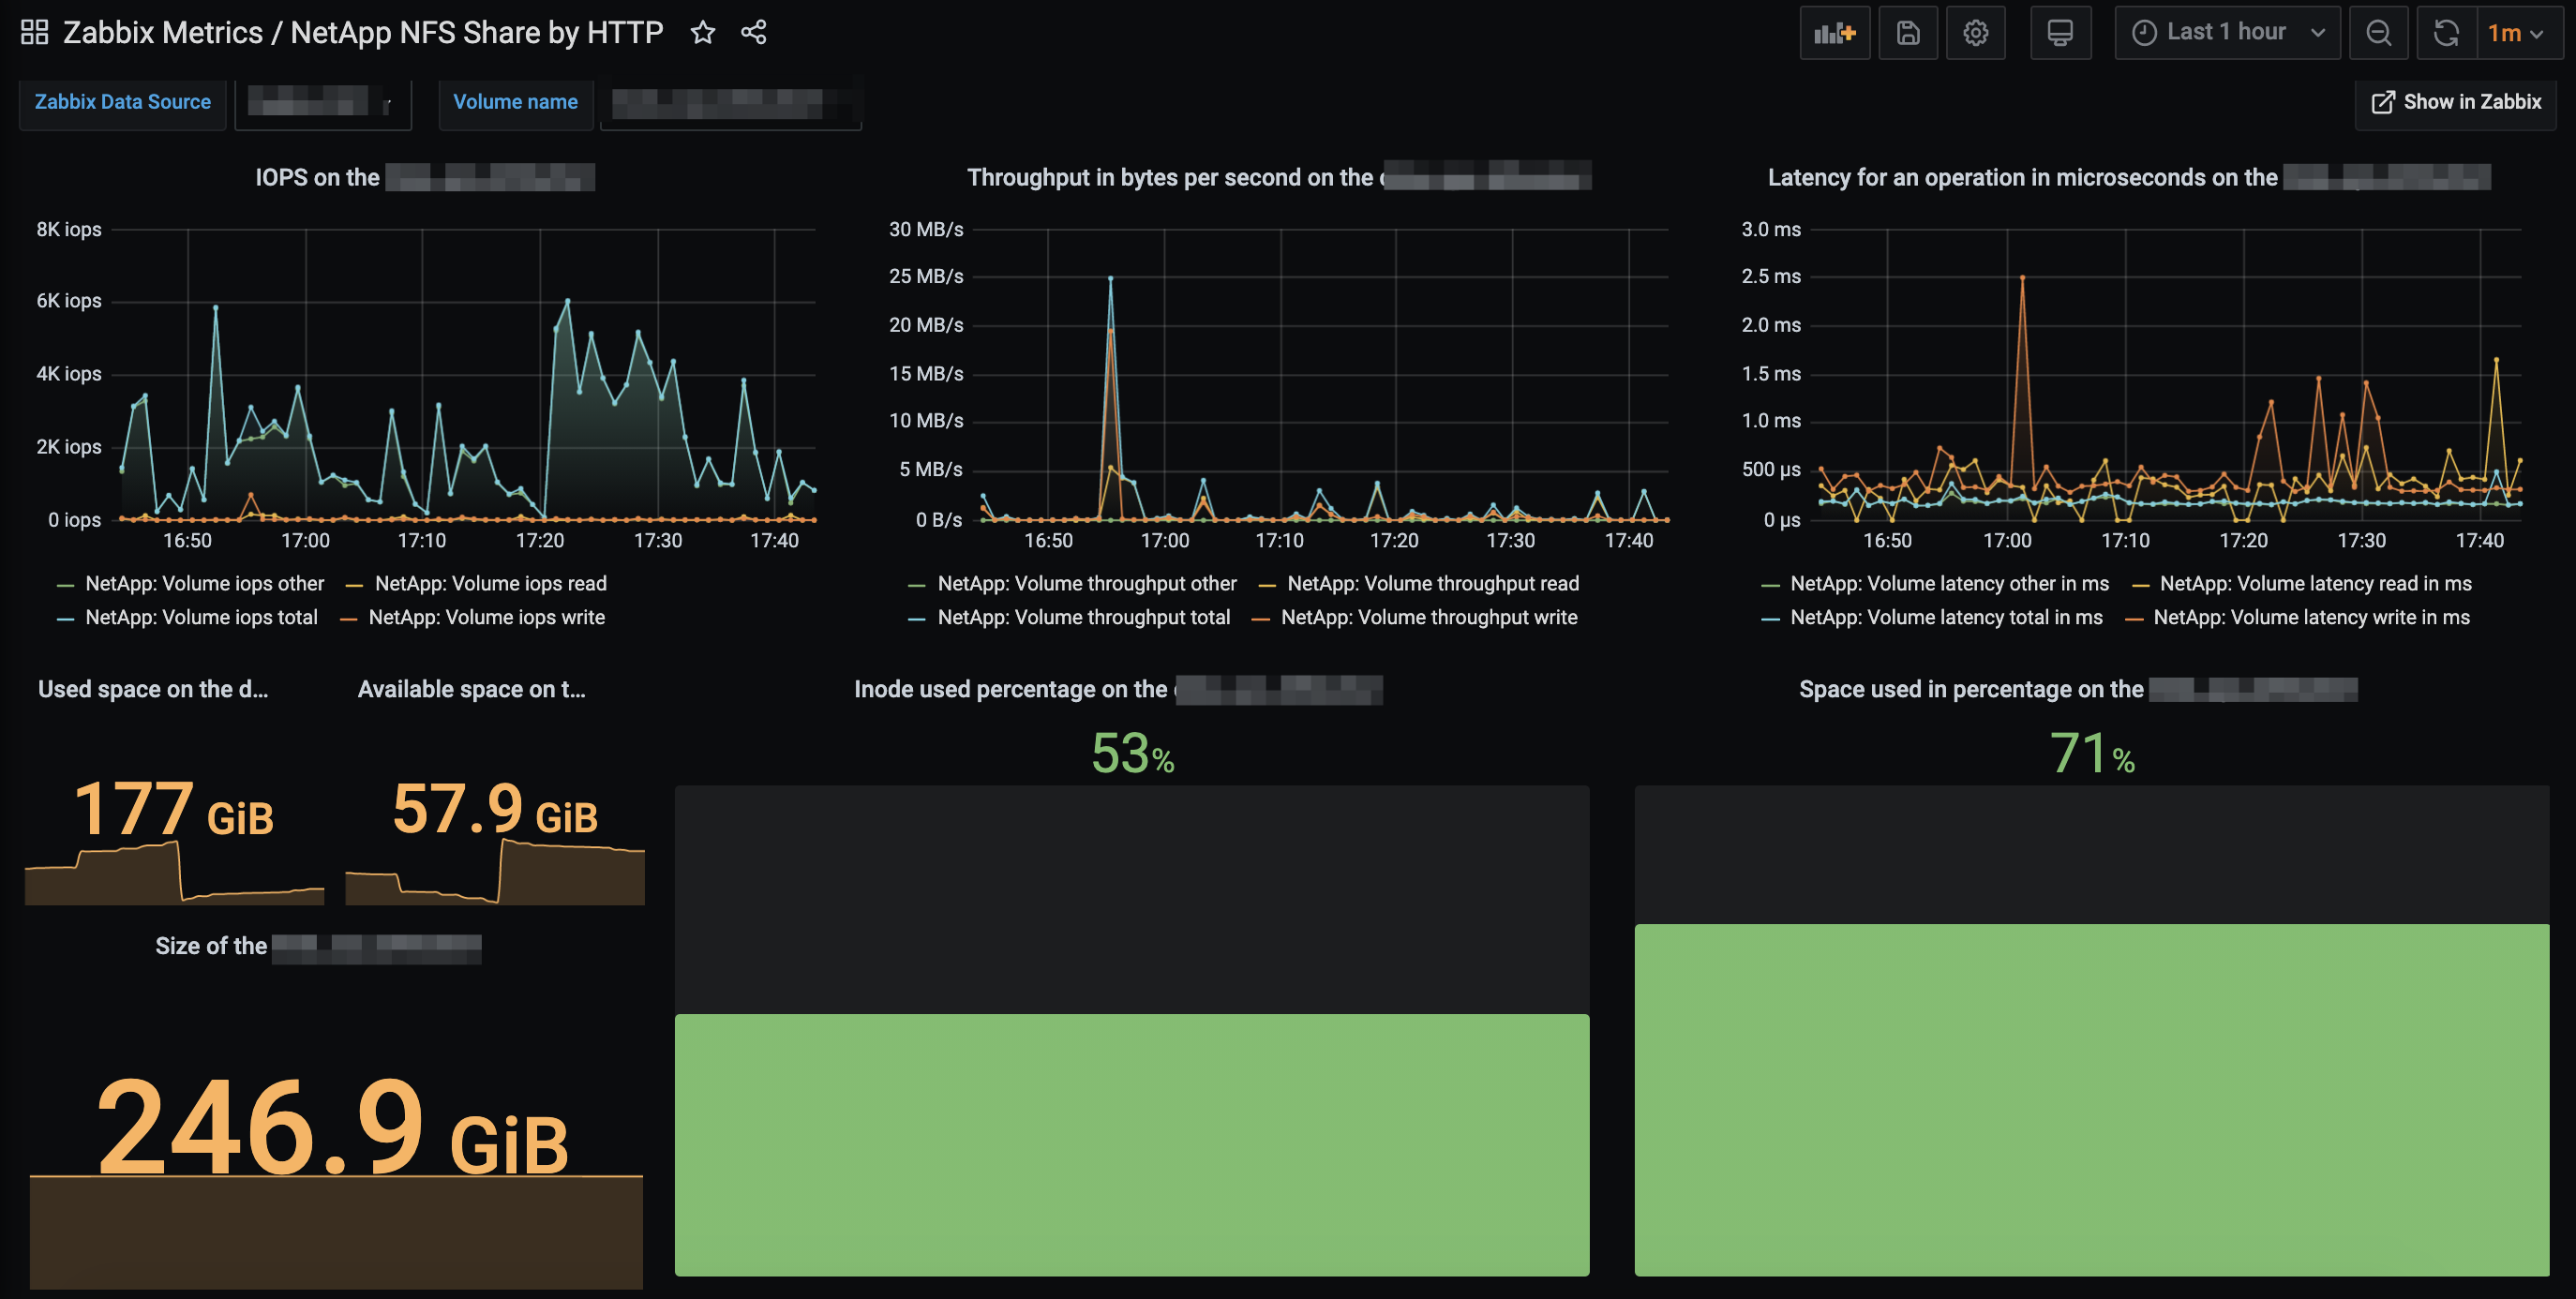
В правом верхнем углу есть кнопка Show in Zabbix, с помощью которой можно провалиться в Zabbix и увидеть все метрики по выбранному тому.
Итоги
Осталась всё та же автоматическая постановка/удаление томов на/с мониторинг/а.
Избавились от скриптов и перестали ддосить коллег из ДЦ.
Метрик стало чуть больше и они стали информативнеее.
