Using PVS-Studio Static Analyzer in C and C++ Development for Embedded Systems

This article will tell you how to launch analysis of an embedded project and how to work with the analyzer’s report. The PVS-Studio analyzer supports a number of compilers for embedded systems. The current version allows checking projects built with one of the following compilers under Window, Linux, and macOS:
Installation
The installation procedure depends on the operating system you use in development. Under Linux, you can install the analyzer from either the repository, or the installation package.
For example, on a Debian-based system:
wget -q -O - https://files.viva64.com/etc/pubkey.txt | sudo apt-key add -

sudo wget -O /etc/apt/sources.list.d/viva64.list \
https://files.viva64.com/etc/viva64.list

sudo apt update
sudo apt install pvs-studio
or
sudo gdebi pvs-studio-VERSION.deb
Under macOS, you can use Homebrew for installation and updating:
brew install viva64/pvs-studio/pvs-studio
brew upgrade pvs-studio
Another option — installing from the dmg package, or unpacking from the archive manually.
Under Windows, you need to use the installer:
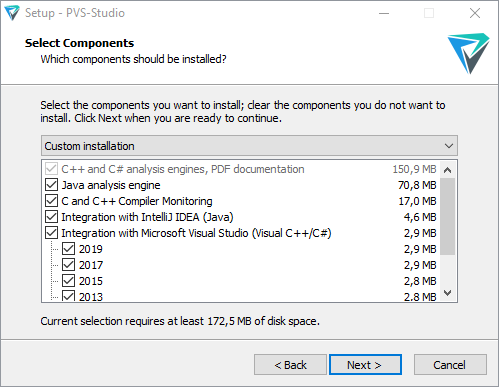
You can download installation packages for each supported system, as well as request a trial key, should you need it, at the «Download and evaluate PVS-Studio» page.
Once the installation is done, you need to enter the license key. The «How to enter the PVS-Studio License and what’s the next move» documentation article describes this process in detail in regards to different platforms.
Checking your Project
Checking projects built for embedded systems is similar to checking those developed for Windows, Linux, or macOS.
Options available in Linux are described in the «Getting Started with the PVS-Studio Static Analyzer for C++ Development under Linux» article. Keep in mind that embedded projects are cross-compiled, and your compiler can have a non-standard name. Due to this, you might need to specify it when launching the analysis, which you can do via the –compiler, or –c, command-line key.
pvs-studio-analyzer analyze -c MyCompiler
Using it is necessary if the analyzer can’t detect the compiler type, that is, if it issues the «No compilation units found» error.
Since the target platform differs from the development one due to cross-compilation, you’ll probably also need to specify the target platform via the --platform key, along with the preprocessor type (--preprocessor).
Supported platforms: win32, x64, linux32, linux64, macos, arm.
Supported prerocessors: gcc, clang, keil.
Under Linux, the linux64 platform and the gcc preprocessor are the defaults.
If you’re using Windows, you can check your project in the compiler monitoring mode. To do so, use the »C and C++ Compiler Monitoring UI» utility, which comes with the analyzer. To start monitoring, go to the Tools menu and pick Analyze Your Files… This dialog will open:

Click the »Start Monitoring» button and start building your project. When the build finishes, click the »Stop Monitoring» button in the dialog window located in the bottom-right corner of the screen:
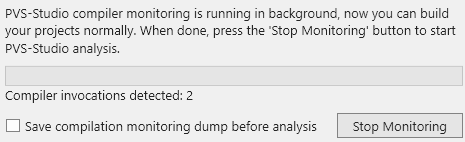
The main window of the »C and C++ Compiler Monitoring UI» utility allows you to view the analysis results.
Also, it is possible to start the analysis from the command line by using the CLMonitor utility. Here’s the command which will initiate monitoring:
CLMonitor.exe monitor
After the build, start it again in analysis mode:
CLMonitor.exe analyze -l "\out.plog"
The analyzer will check your project and save the results to the file specified via the -l key.
See also «Compiler Monitoring System in PVS-Studio».
Working with Reports
To view the report under Linux, you need to convert the log file, generated by the analyzer, into one of supported formats. Use the plog-converter utility to do this. For example, you can generate an HTML report, which allows you to view source code, with this command:
plog-converter -a GA:1,2 -t fullhtml /path/project.log -o /path/report_dir
Report conversion is described in more detail in the «Getting Started with the PVS-Studio Static Analyzer for C++ Development under Linux» article.
The Windows version also has a utility named PlogConverter, which is similar in usage to its Linux counterpart:
PlogConverter.exe \out.plog --renderTypes= FullHtml --analyzer=GA:1,2
or
PlogConverter.exe D:\Projct\out.plog -t FullHtml -a GA:1,2
You can also view reports in plog format with the »C and C++ Compiler Monitoring UI» utility via the File→Open PVS-Studio Log… menu command.
Example:

If you need to, you can export the report to one of supported formats via the utility’s File menu.
MISRA coding standard
PVS-Studio classifies its warnings according to CWE and SEI CERT, which works quite well for static security testing (SAST) of regular apps. However, embedded systems have different security requirements, covered by a specially developed MISRA standard. The current PVS-Studio version partially supports MISRA C and MISRA C++. You can see the regularly expanding list of supported rules here.
Using MISRA rules when checking non-embedded projects is usually a bad idea, due to the standard’s specifics. In most cases, if the code wasn’t initially MISRA-oriented, the check would result in many false positives and generally noise warnings. Thus, MISRA rules are off by default.
To enable MISRA under Linux, run the analysis with the -a key and pass a numeric parameter, according to the desired mode. This parameter is a combination of bit fields:
-a [MODE], --analysis-mode [MODE]
        MODE defines the type of warnings:
        1 - 64-bit errors;
        2 - reserved;
        4 - General Analysis;
        8 - Micro-optimizations;
        16 - Customers Specific Requests;
        32 - MISRA.
        Modes can be combined by adding the values
        Default: 4
Example (with GA and MISRA rules enabled):
pvs-studio-analyzer analyze -a 36 -o /path/report.log
Also, you need to tell plog-converter to include MISRA warnings in the resulting report:
plog-converter -a MISRA:1,2,3 -m misra ....
Under Windows, you can use the »C and C++ Compiler Monitoring UI» utility’s settings:

See the «PVS-Studio: Support of MISRA C and MISRA C++ Coding Standards» article to learn more about MISRA support.
Conclusion
In this article, we’ve briefly discussed the PVS-Studio analyzer’s features for checking embedded-targeted projects. If you need more information on using the analyzer, I recommend that you refer to the following articles:
