Хакатон от NASA: Space Apps Challenge
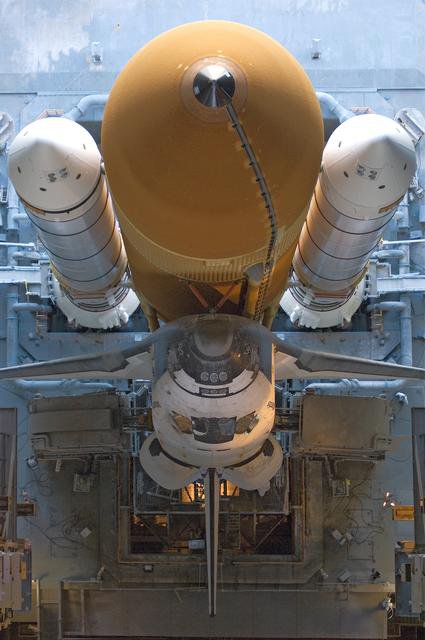
20–21 октября по всему миру пройдет хакатон Space Apps Challenge. Событие проходит как часть инкубационной программы NASA, так что все серьезно: участникам предоставят научные данные и ресурсы NASA, спутники, космические зонды и другие активы.
Хакатон проходит второй раз, в прошлом году в нем приняло участие 25.000 энтузиастов из 187 стран. В этом году в Москве его организовывает крупнейшее русскоязычное комьюнити участников хакатонов Russian Hackers.
Участникам предстоит на 48 часов объединиться с разработчиками, дизайнерами, учеными и со всеми, кто хочет сделать мир лучше.
На хакатоне можно реализовать любую космическую задумку — сделать игру на основе снимков телескопа Хаббл или придумать исследовательскую миссию на Луне, следить за запусками ракет, отправиться в будущее на 100 лет, создать сенсор для робота на Марсе, свое собственное произведение космического искусства: кино, музыку, игру, визуализировать криосферу, спроектировать капсулу времени, рассчитать место посадки планетохода.
Лекции
На мероприятии можно посоревноваться в создании проектов и узнать чем живет космос и какое место в нем занимают информационный технологии.
Среди лекторов:
- Вячеслав Дмитриев, МАИ, поделится опытом стратосферного запуска аппарата формата Cubesat.
- Георгий Потапов, Сколково, расскажет об использовании машинного обучения при обработки спутниковых снимков: какие данные можно извлечь и как.
- Виктор Рудой, Data Acquisition & Community Manager HERE, c лекцией Back to the Earth: индекс реальности HERE.
- Александр Шаенко, создатель проекта 435nm.
- Родион Мамин, COO проекта Spacebit, расскажет о возможных применениях блокчейна в космосе.
- Алексей Стаценко, Jethackers.ru, расскажет про историю реактивных ранцев, про то, какие аппараты сейчас есть в мире и про то, как идет разработка первого российского турбореактивного аппарата вертикального взлета (VTOL).
На хакатон открыта регистрация: 2018.spaceappschallenge.org/locations/moscow
Задать вопросы и найти команду можно в чате участников хакатона: t.me/nasaspaceapps_moscow
Челленджи
1. Can you build a…
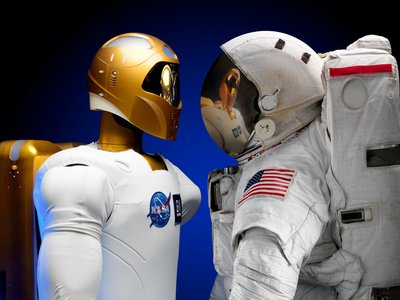
Design by Nature

Спроектировать автономный летательный аппарат для проверки космического корабля на наличие повреждений от микро-метеоритов и космического мусора (MMOD).
For all post-Columbia missions, astronauts controlled robotic manipulator arms containing 3D sensors for hours to survey most of the Orbiter«s external TPS surfaces. As a result, the process of survey for damage detection and characterization of damages was perfected for the Space Shuttle. Today, International Space Station (ISS) remote manipulator arms are used to inspect the ISS and visiting vehicles for Micro-Meteoroid and Orbital Debris (MMOD).
The TPS for future spacecraft that will travel to and beyond the moon faces a high risk from MMOD impacts. Also, the remoteness of the journey demands a high degree of autonomy. Limited communication to Earth and limited image downlink means ground control of inspection tools is challenging. Analysis of all inspection images on Earth means more ground crews and longer timelines to reach decisions. Control from in-space crews on future spacecraft or space stations use precious crew time and robotic manipulator time as well.
Currently there are several small satellite spacecraft projects that are investigating technologies for inspection. When commanded/scheduled, the designated free-flyer surveys the area assigned, identifies and maps real damage sites, and— for those damages that are assessed to exceed the threshold or do not meet decision criteria confidence factors— performs damage characterization of individual damage sites.
Mother Nature«s elegant solutions for this problem are unexplored! What aspects of Nature could help you design an efficient and effective autonomous operations sequence for imaging and controlling a free-flyer in order to detect and characterize MMOD impact damage? Would you scan for damage like a farmer plowing a field, or like an eagle looking for prey? Results of your efforts could have broad implications for a number of spacefaring entities, including commercial industry, and could have applications on an international scale.
Potential Considerations
What components, structures, or patterns of Nature (or inspired by Nature) are your machine and/or operations sequence based on?
What types of sensors will your flyer use? Visual? Electromagnetic? Sensors based on sound?
In your designs, you may consider the following (this is not an exhaustive list):
- Dimensions of the damage: The width of the MMOD entry hole is usually small compared to the depth; angle of impact is not known
- Lighting and shadows: light sources/shadows, surface reflections, view angles, camera/sensors
- Inspection surface: Cone-shaped inspection surface geometry; distance of free-flyer from inspection surface
- Zero-g, vacuum of space, orbital mechanics/relative motion (would capsule be made to spin to support survey, or not spin to support damage site characterization?)
- Flight plan optimization for reliable results, free-flyer efficiency, and/or spacecraft efficiency (e.g., propellant/power used, inspection time, etc.)
- Autonomy and minimum crew time (In-space or on-ground? Would you use local or remote communications? On-board imaging and processing? What type of decision logic would you use to direct the free-flyer operations?)
Примеры предоставляемых ресурсов:
Make sense out of Mars

Создать сенсор, который люди могли бы использовать для исследования Марса. Черпать идеи можно из роботизированных миссий NASA на Марсе.
Background
It«s only a matter of time before we are able to go to Mars and see, touch and inspect things that have only been visible through the lenses of landers, rovers, and orbiters. We will have the opportunity to build upon decades of past science experiments from robotic missions, and we will explore familiar and new terrains and environments on Mars in person.
Your challenge is to create a sensor (or cluster of multiple sensors) to be used by humans on Mars. For this challenge, your options for scientific exploration are endless! What interesting features of the Mars environment would you want to observe and measure? Will your sensor be a wearable device that monitors its target constantly, or will it be a portable device that you deploy to move underground, on the ground, or even flying around the planet? Will your sensor uncover something about how humans respond to short- or long-term stays on the red planet?
We are excited to see what you dream up and build!
Potential Considerations
- The sensor could be for an initial short-term Mars mission or to be used while humans are permanently living on the red planet.
- Can you repurpose existing technology on Earth to be used by humans on Mars?
- Or, can you improve technologies from NASA«s robotic Mars missions to be operated by humans? What benefits would you take advantage of with a human (versus robot) operator? How would you address any drawbacks?
Примеры ресурсов:
Do you know when the next rocket launch is?
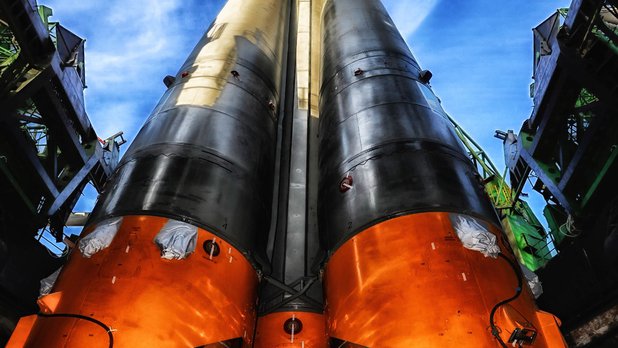
Создать приложение, с расписанием запусков космических аппаратов и информацией о них. Cоветуем сделать упор на UI/UX.
Background
In the emerging era of privatized spaceflight, another space-bound rocket seems to launch every week. Nations around the world have launched rockets carrying satellites and space probes within the past few years. Private companies are now doing launches as well.
Your challenge is to collect flight schedules and projected launch dates to assemble an app/website/online tool with all the latest rocket launch information.
Potential Considerations
- What factors go into a decision to launch?
- What are the most common causes of scheduling changes in launches?
- Where are the world«s major spaceports?
- Where are good surrounding sites to view each rocket launch?
- Which company or government does the rocket belong to? What about the payload?
- Can the launch be viewed live online? If so, what«s the URL?
- Include as much useful information as you can!
Примеры ресурсов:
Choose your own

Работать над собственным проектом, если он не подходит ни под один другой челлендж категории, используя данные NASA. Абсолютный творческий полет для команд, однако вы не сможете претендовать на главный приз.
Background
Do you have an idea that doesn’t fit any of the other challenges? This is the place for you, whether you want to design and develop an app, create data visualization, hack on an Arduino… or anything else you can think of using NASA data!
Take a look at the resources we have provided, and maybe you«ll find something that inspires you.
Develop your own challenge, and then create your own solution.
Potential Considerations
- You can work in a team on something that you’re all passionate about
- All of NASA«s data are free, open, and publicly available for you to use
- By choosing to Bring Your Own Challenge, you will not be eligible for a Global Award
Примеры ресурсов:
2. Help others discover the Earth
Artify the Earth

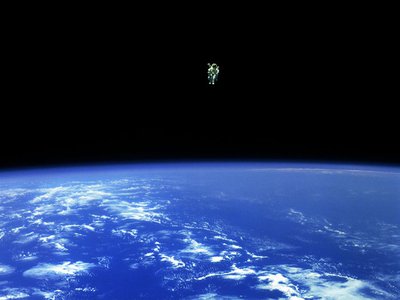
Создать произведение искусства используя спутниковые снимки NASA или написать для этого сервис/приложение.
Background
NASA has collected images of the Earth for over five decades. In addition to helping us understand the biosphere, hydrosphere, cryosphere, lithosphere, and atmosphere, these images show us the incomparable beauty of our home planet. For this challenge, take in these breathtaking images, be inspired, and allow your artistic imagination to go wild!
Your challenge is to adapt NASA images or other spectral data to a medium of your choice, and develop your own interpretation of NASA«s Earth observations. Or, build a tool or an application that allows others to transform or enhance NASA«s Earth images or spectral band data into novel creations. What you create can inform, educate, or inspire.
Potential Considerations
If you are creating with spectral band data, consider the following:
- Optical images, or what we see as multicolored images, are made of measurements of spectral bands gathered from NASA«s missions. An example of image transformation is assigning spectral bands to different Red, Blue, and Green (RBG) color assignments to create alternate renditions
- There is an incredible number of phone applications used to manipulate imagery for artistic purposes. These applications change image clarity, adjust color tone, apply unique filters, merge multiple images together, fragment images into patterns, and transform pictures into works of art in the style of famous painters, illustrators, and artists. Any combination of these features or others will also allow users to create unique pieces of art
- You might consider how your project could be used for educational purposes. For example, if developing a tool to manipulate spectral band data, consider adding features that share information about the satellite missions that gathered the data, the spectral bands used to create the RBG image, or the area being displayed (natural history, geography, sociology)
- Data inputs could run the gamut of NASA data and include even more than just Earth imagery, allowing for art based on imagery of other planets
- Consider incorporating data that go beyond optical properties, like elevation layers (e.g., see Shuttle Radar Topography Mission resource provided below), or processed products that represent physical characteristics of the planet
Examples of Resources
See NASA Global Imagery Browse Services (GIBS) earthdata.nasa.gov/gibs for access to over 400 satellite products.
NASA Worldview worldview.earthdata.nasa.gov is an easy way to visualize GIBS data in your browser.
NASA«s Earth Science Data Systems Program, science.nasa.gov/earth-science/earth-science-data, describes several sources of Earth science data.
NASA Earthdata Search search.earthdata.nasa.gov allows you to search, discover, visualize, refine, and access NASA Earth Observation data.
The NASA Scientific Visualization Studio svs.gsfc.nasa.gov wants you to learn about NASA programs through visualization. The SVS works closely with scientists in the creation of visualizations, animations, and images in order to promote a greater understanding of Earth and Space Science research activities at NASA and within the academic research community supported by NASA.
Shuttle Radar Topography Mission: www2.jpl.nasa.gov/srtm
1D, 2D, 3D, Go!
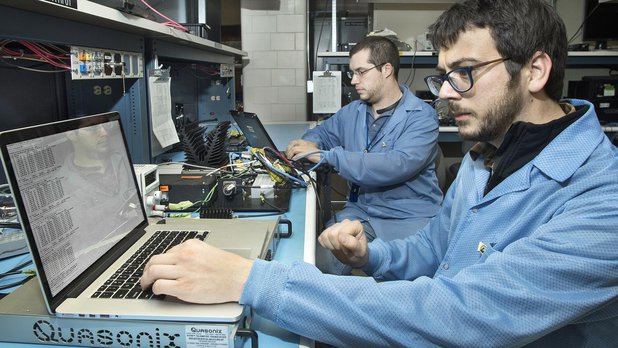
Разработать и развернуть веб-приложение, которое позволит исследовать Землю прямо из браузера. NASA предлагает визуализировать данные о спутниках, миссиях, пожарах, метеоритах, облаках, погоде.
Background
Web apps are amazing tools to engage and educate people about Earth through visualization of science data and the science satellites that orbit the Earth. Think of data files as one-dimensional (1D). This challenge invites the data scientist in you to create web apps that convert sets of two-dimensional (2D) and three-dimensional (3D) coordinates into 1D data files that can be displayed on virtual world maps and globes.
Programming beginners are invited to create web apps that present 2D imagery using web-based scripting and block-based programming environments. Intermediate and advanced programmers are invited to integrate data sources with virtual globes and web-based programming environments.
Ideas for potential web apps include but are not limited to:
- Conversion utilities
- Trajectory visualization of orbiting satellites
- Mobile phone apps of Earth science data imagery
- Reusable code to access data from virtual globes
- Integrating virtual globes with web-based programming environments
Mission analysis applications can generate 2D or 3D coordinates in Comma Separated Value (CSV) format. Potential conversion utilities could, for example, transform the CSV data into JavaScript Object Notation (JSON) or GeoJSON for presentation on a virtual globe. Earth science 2D images could be imported to web-based programming environments such as Scratch. Several NASA data sets are in formats that could be imported into virtual globes. Integrating a virtual globe with Scratch via JavaScript could help students to use virtual globes. Design your web apps to engage the general public, especially teachers and students!
Potential Considerations
- Free virtual globes provide functions to import Earth science data
- Free code libraries and web-based programming environments enable presentations of 2D images and 3D data visualizations
- Free mission analysis tools enable the generation of trajectory coordinates.
- Free repositories and web app hosting platforms enable collaborative development and deployment of web apps that present Earth science imagery and visualization of trajectories
The Example Resource Descriptions section provides links to demonstrations, tutorials, virtual globes, code libraries, and mission analysis applications.
Many projects and previous Space Apps Challenge products are available on an open source code repository. A few code repositories offer free web page hosting; thus, projects can provide their source code and host a web page with the embedded web app within the same repository. Then you will be able to embed or link to the app from your project page.
Source code and models for interactive 3D web apps should be free for reuse. Additionally, a good solution would be one that is well commented and documented, and demonstrated via a working web app embedded in a web page. Code and models ideally might be written so that they can be adapted and reused by citizen scientists interested in designing their own space missions.
Examples of Resources
The Web Mission Visualization Tutorial series provides tutorials and demos on how to use NASA«s GMAT and JavaScript to create interactive 3D web apps that depict space missions. (Link coming soon.)
The Inner Solar System is a JavaScript web app that includes an orbital propagator. (Link coming soon.)
The Elliptical Orbit Design is a tutorial that explains how to implement a relatively simple orbital propagator that enables animation of visualizations. (Link coming soon.)
NASA 3D Resources is a great place to find models of satellites that can orbit a virtual Earth globe: 3D Models
NASA«s Open Data portal — An excellent starting point for finding data sets, reusable code, and Application Programming Interfaces:
NASA Developer Resources
NASA APIs
NASA Open Data
NASA Open Earth Exchange (OpenNEX)
NASA data sets suitable for importing into virtual globes:
Keyhole Markup Language (KML) data sets
GeoJSON data sets
NASA Web Worldwind:
Tutorials
Application Programming Interface documentation
Space Mission Planning Applications
Mission planning applications can generate trajectory coordinate data that can be visualized via 3D code libraries and virtual globes.
NASA«s General Mission Analysis Tool (GMAT)
Suggested keywords for online resource searches:
- Orbital propagator and JavaScript
- 3D graphics code libraries
- Keplerian parameters
- Two Line Element sets or TLE resources
- Current NORAD Two Line Element sets
Space Apps: The Documentary
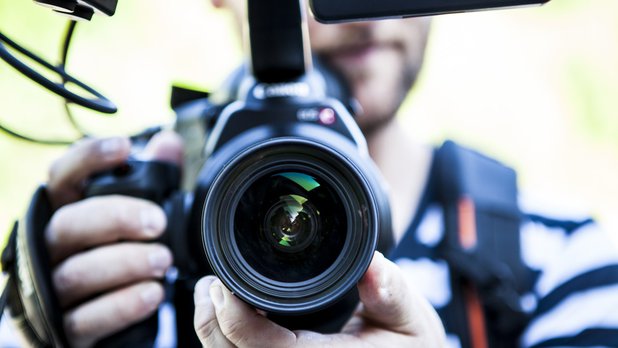
Снять пятиминутный документальный фильм о международном хакатоне Space Apps.
В фильме надо захватить атмосферу хакатона, рассказать о решениях и стоящих за ними историях, о командах или о любых других интересных Вам аспектах.
Background
Since the first International Space Apps Challenge in 2012, thousands of participants from hundreds of locations have developed unique and inspiring solutions for NASA challenges. Participants like YOU come together for a weekend full of excitement, storytelling, and fantastic multi-disciplinary science and engineering. We want to hear your sensational stories!!! Whether it«s preparing for and traveling to the event location, making friends and connections at the hackathon, or developing a winning solution — share your memorable Space Apps experiences with the rest of the world!
Your challenge is to produce a five-minute (or less) documentary of NASA«s International Space Apps Challenge and what it means to you.
For this challenge, you and your creative team may choose to cover:
- The mysteries of Earth and space that you have learned about through Space Apps
- Your local event where you follow one team, or all teams
- Particular solutions and the stories behind them
- The heroes behind the scenes — how local hosts lead and bring an event together
- The history of Space Apps, previous teams or solutions, or anything from the Space Apps past that has inspired you
- Any aspect of the hackathon that you find interesting
Document the experience in a creative film. Make sure to include as much material as possible when you upload or embed your content into your project page (final edit of your film, scripts, cast and crew listing, equipment list, storyboards, etc.).
Potential Considerations
Since your team may only have a short amount of time to produce and edit your film, you might divide and conquer the tasks ahead of you, including script writing, directing, acting, interviewing guest speakers, adding music, editing, managing lighting, sound, serving as artist, or production assistant etc.
Consider what equipment your team might need to produce your film, such as audio/video recorders, microphones, and lighting. A modern smart phone should be able to perform all of these functions, but think about how you can increase production quality with specialized equipment. If your team does not already have specialized equipment, your team may be able to collaborate with others to provide it.
Keep in mind is that sound is often considered the most important component of a video. An audience can forgive poor video quality, but hardly forgive poor audio quality.
Consult resources available on the internet to help you plan and produce a short film. For example, there are sites with tools that allow 3D modeling and animation, audio recording, and editing, and/or there are sites that guide you through the process of going from idea to researching, outlining, making a shot list, and writing a script.
If chosen as a Global Award finalist, think about how the footage could be edited in order to create a trailer to submit as your 30-second video entry.
Примеры ресурсов:
3. Volcanoes, icebergs, asteroids (oh my)
Don«t forget the can opener

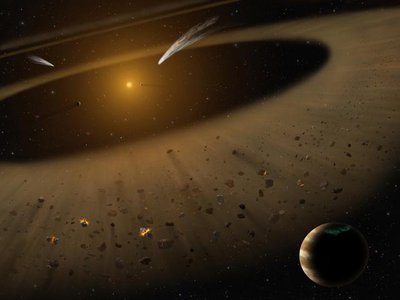
Создать простой способ организовать планы и информацию на случай чрезвычайных ситуаций. Инструмент должен работать без интернета и объяснять, как действовать в случае разного вида катастроф и как стоит к ним подготовиться.
Background
When Earth surprises you, make sure you have an emergency preparedness kit. In fact, have more than a kit — know your disaster, and know your plan.
Some things everybody always needs — water, food, a family meetup/contact plan — but some things are specific to your family (e.g., medicines, diapers) and some items/preparations are specific to certain disasters and situations, for example: plywood for boarding windows before typhoons; face masks for dust, ash, or smog; a go-bag for bugging out; or a safe refuge for you and your pets.
What you develop should help people understand the different kinds of preparedness for each disaster — what are the main threats for each? For example, in an impending storm, people tend to think about the wind, but it«s often the storm surge or flooding that hold the potential for greatest harm; when a volcano erupts, it«s not just the lava — it«s the ash that falls, and the noxious gases in the air, too.
Potential Considerations
Different surprises need different strategies. Help people know whether they are likely to need a go-bag for evacuating, or a kit and plan for sheltering in place, and what should go in each. Help them figure out what order to do things in. Illustrate and explain each disaster type with one or more NASA images, videos, or data visualizations, so that people genuinely understand what they are preparing for. Whatever you design, have it be something that can still be used when the internet goes down. You might have it prompt people to think about their own special-need items and things they might be forgetting — and have it warn them if their virtual go-bag gets too heavy to carry!
Примеры ресурсов:
Spot that fire!
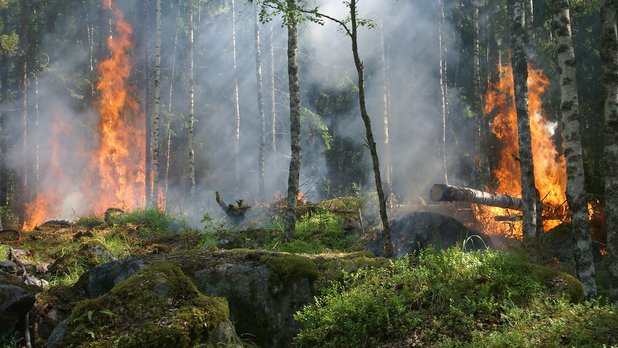
Применить краудсорсинг, чтобы люди могли вносить свой вклад в обнаружение, подтверждение и отслеживание лесных пожаров. Решением может быть мобильное или веб приложение.
Background
Over the past year, we have witnessed long and arduous battles against record-breaking wildfires across the world. Some of these fires burned thousands of acres of land and destroyed hundreds of homes and buildings. Additionally, smoke from the fire creates issues related to poor air quality, raising health concerns for people not just in the vicinity of the fire, but at distances hundreds of miles away.
A key to preventing harmful wildfire destruction and spread is early and effective detection. NASA researchers have been striving to reduce the time it takes to detect fires using satellite information from 3–4 hours to ten minutes or less. Crowdsourcing can support real-time detection and monitoring of natural disasters, including wildfires. Your challenge is to develop a web-based or phone/tablet-based app that helps engage the public in wildfire prevention and early wildfire detection.
Potential Considerations
Teams are invited to develop a web-based or phone-based app that will allow citizens to participate in wildfire early detection, verification, tracking, visualization, and/or notification. Apps can focus on one or more of the following suggested topics, but you are not limited to these!
- Report a fire: e.g., upload textual and multimedia (such as picture or video with geolocation) materials, etc.
- Verify and screen fire reports: e.g., check with NASA fire database, cross-checking, verify whether a picture/video is fire-related (through machine learning for example), etc.
- Notify communities at risk: e.g., notify close-by residents and local fire departments, notify people driving in the vicinity, allow people to subscribe to fire warnings, etc.
- Track and visualize fires: e.g., show fire locations and tracks on maps, embed animation, display detailed fire data, etc.
- Build mashups: i.e., integrate geospatial data from various sources to provide innovative services to citizens (e.g., local weather and local traffic), typically through their published APIs (application programming interfaces)
In order to make your efforts sustainable after the event and to allow the community to continue with your innovative ideas, your solution may:
- Provide a brief description of the app or solution goal and design — what does it do and how
- Offer the description (a story) of why this app or solution is important and what insights or future capabilities it provides with regard to fighting wildfires
- Leverage NASA state-of-the-art technology, including: near-real-time fire database and satellite image processing APIs accessible through the NASA OpenNEX App Store
- Provide a description of and links to other open-source tools used in the development
How does your app encourage citizen participation to support this human-based remote sensing initiative on wildfires?
Примеры ресурсов:
Hello Bennu
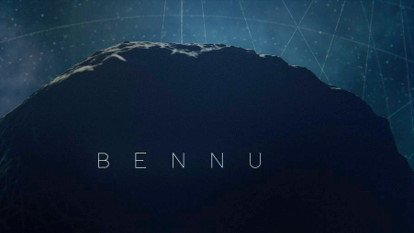
Сделать видео про астероид Bennu. На этом астероиде могут быть молекулярные предшественники органической жизни нашей планеты. А еще этот астероид, возможно, упадёт на Землю в конце 22 века.
Background
Where did we come from?
What is our destiny?
Asteroids, the leftover debris from the solar system formation process, can answer these questions and teach us about the history of our sun and nearby planets.
The OSIRIS-REx spacecraft is traveling to Bennu, a carbonaceous asteroid whose regolith may record the earliest history of our solar system. Bennu may contain the molecular precursors to the origin of life and the Earth«s oceans.
Bennu is also one of the most potentially hazardous asteroids, as it has a relatively high probability of impacting the Earth late in the 22nd century. OSIRIS-REx will determine Bennu«s physical and chemical properties, which will be critical to know in the event of an impact mitigation mission.
Finally, asteroids like Bennu contain natural resources such as water, organics, and precious metals. In the future, these asteroids may fuel the exploration of the solar system by robotic and manned spacecraft.
Your challenge is to make a video to tell the world what you think about Bennu!
Potential Considerations
Use your imagination and tell your story of what you think about Bennu. What part of NASA«s OSIRIS-REx mission is most exciting to you? What discoveries do you think we will make at Bennu? Whatever you think is cool about Bennu, tell the world about it!!!
You can share a poem or a song, a dance or a presentation— you can even make a video from Bennu«s perspective!
Примеры ресурсов:
4. What the world need now is

Looking GLOBE-ally
Использовать данные проекта GLOBE, чтобы помочь людям лучше узнать нашу планету через анализ и визуализацию данных. Данные представляют собой датасеты из фотографий и их описаний, привязанные к гео координатам.
Background
With the GLOBE Observer app, NASA collects data from citizen scientists around the world who are looking at clouds, mosquito habitats, and land cover. These data have the potential to be displayed or used in concert with NASA satellite data to identify or communicate information, and to educate the public about planet Earth.
For example, linking «ground observations» (observations made by citizen scientists at ground level) of clouds to satellite observations provides a unique perspective, allowing us to see atmospheric processes from two very different viewpoints.
As another example of citizen science in action, data on mosquito occurrence can be linked with environmental information gathered through remote sensing to predict where else mosquitoes are likely to be found. This information can be useful for public health officials wishing to reduce the spread of mosquito-borne illnesses, like malaria and Zika virus fever.
What ways can you analyze and/or display NASA data to communicate interesting findings or improve public understanding of our home planet? This could include technical platforms like apps and/or websites, but it also could include creative uses like games, images, or videos!
Potential Considerations
- The data collected from citizen scientists consist of photographs as well as descriptive information — for example, type of clouds, percentage cloud cover, type of mosquito habitat, percentage of land covered by trees, etc. Each observation has a latitude/longitude location. The different types of data may need to be displayed in different ways
- The GLOBE Visualization System and the GLOBE Advanced Data Access Tool contain data from all protocols in the GLOBE Program, not just those collected via the GLOBE Observer app. You will find the layer for Clouds under the Atmosphere section, Mosquito Habitat Mapper under Hydrosphere, and Land Cover under Biosphere. Feel free to explore the other types of data if you wish.
- The data summary for data points on individual clouds in the GLOBE Visualization System will have a link to a satellite matching page, which indicates if a match was made. Other useful types of data (plus examples of satellite sources — see Resources for the locations of data) to compare to the citizen science ground observations include:
- Clouds: Cloud Fraction (Aqua/MODIS, Terra/MODIS)
- Mosquito Habitat Mapper: Precipitation (GPM/IMERG), Soil Moisture (SMAP), Vegetation (Landsat, Terra/MODIS), Surface Temperature (Aqua/AIRS)
- Land Cover: Vegetation (Landsat, Terra/MODIS),
- Feel free to think creatively! An example application could create a game where individuals test their ability to know an environment based on viewing it from space. The game would give players a choice of images gathered from the land cover app and an optical remote sensing image. Can players pick the correct image associated with that location? This application would help the public connect with satellite imagery and could also gather data on locations that are frequently misidentified. This capability could be used to outline future educational needs or identify images that have been incorrectly logged in the GLOBE App.
Examples of Resources
GLOBE Data Sources
- GLOBE Observer App: observer.globe.gov, and downloadable from the App Store and Google Play. It«s not necessary to download the app to complete this challenge, but collecting some data yourself may be helpful.
- GLOBE Visualization System: vis.globe.gov. Displays GLOBE data on a map, and allows you to look at detailed information about individual data points. Also allows downloading of data tables of an entire layer or a selected subset of a layer. At the moment, this is the only way to access photos taken as part of data collection, which must currently be done for each data point individually.
- GLOBE Advanced Data Access Tool: datasearch.globe.gov. This tool allows you to find and retrieve GLOBE data using several different search parameters. You will be presented a summary of sites that have data available based on your search parameters. From those sites, you can further refine your search and/or download the data into a CSV file for detailed analysis. A summary CSV file is also available that summarizes the data available for each site.
- Tutorials for retrieving and visualizing your data: www.globe.gov/get-trained/using-the-globe-website/retrieve-and-visualize-your-data.
Satellite Data Sources:
The land where displaced people settle
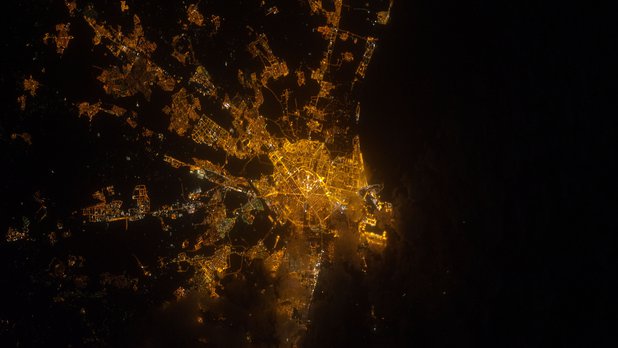
Участникам предстоит определить площади и особенности неформальных поселений беженцев, используя спутниковые снимки. К примеру, можно оценивать изменения растительности или количества света ночью. Решение должно быть масштабируемым и учитывать особенности локальной географии.
Background
The number of people displaced from their home communities because of natural disasters or conflict has grown to 68.5 million people worldwide. Approximately 40 million of these people are Internally Displaced People (IDP), since they remain inside their country’s borders. Another 25.4 million leave their countries and settle abroad as refugees, with the remaining roughly 3.1 million being at an intermediate stage of seeking asylum.
Many IDP and refugees re-settle in urban areas or settlements planned by a humanitarian organization, while others self-settle in unplanned, usually rural settlements. Despite vulnerable people living in these informal settlements for many years and even decades, informal settlements are usually not well mapped and tend to be broadly excluded from census data collection and environmental monitoring. This leaves little systematic information about these settlements regarding their history, land-based opportunities (e.g., local access to water, firewood, and food), and environmental challenges.
Remote sensing imagery collected by NASA satellites and instruments, such as Landsat, MODIS, GRACE, VIIRS, and others, capture an abundance of data related to environmental and climatic conditions, infrastructural change, and nighttime lighting conditions, as well as the multi-year and potentially multi-decadal changes therein. These data can thus give unique insights, and can help to improve global awareness of living conditions at informal settlements, which are home to ever-increasing populations of displaced people around the world.
Your challenge is to design an approach that uses NASA Earth observations data to characterize land cover/land use conditions at informal settlements.
Your approach should be:
- Scalable (i.e., appropriate for application to several settlements),
- Sensitive to the local geography and climate, and
- Easily understandable for the residents, humanitarians, policy makers, scientists, and others who are committed to the welfare of vulnerable populations
Potential Considerations
Your approach could include many kinds of assessments, such as (but not limited to):
- Tracking changes in agricultural or garden greenspace within or surrounding informal settlements;
- Tracking changes in nighttime lights emissions;
- Estimating fuel-wood consumption around the settlement;
- Measuring changes in groundwater; and/or
- Tracking changes in local land cover to identify the specific date when the settlement was established.
These are merely suggestions. You are not required to take on all, or any, of the above, but rather you are encouraged to have a targeted question and application, even if some uncertainty or limitations remain.
Your approach may not be consistently effective across a variety of landscapes populated by informal settlements. That is okay! Consider applying your approach at a range of different sites and identifying where and why your approach works or does not work.
Примеры ресурсов:
Health makes wealth

Использовать данные NASA Earth и медицинские открытые источники, чтобы установить как окружающая среда влияет на здоровье людей и животных.
Background
Our surrounding ecosystems are constantly adapting to a range of environmental conditions, such as seasonal variation, extreme weather patterns, and unexpected natural hazards. These changes, however, may not be easily observed or appreciated in real-time accounts by the human eye. How have your daily activities been affected by a changing environment? How have you observed these changes?
As humans and animals share disease risks within their atmospheric, terrestrial, and aquatic environments, we should survey the planet«s biodiversity through a holistic approach. Using this One Health concept, we can describe the biodiversity through real-time measurements in a two-fold manner. First, Earth science data can provide global measurements of diverse environmental conditions, such as land cover and precipitation levels. Second, citizen science observations by community members are local measurements, like photographs (e.g. photovoice methodology), field notes, and physical measurements. Combining large-scale satellite data with small-scale community observations can serve as a valuable visualization tool for our dynamic ecosystems.
Your challenge is to match NASA Earth science data with potential sources of local citizen science observations to identify how our changing environment may influence human and animal health!
Potential Considerations
As you brainstorm on the elements of this challenge, consider the following:
- How can you describe the daily, monthly, and annual temporal changes of your local terrain?
- How can we better understand real-time changes (e.g., average vs. extreme measurements)?
- How can we showcase real-time environmental changes to enhance educational programs for community members of all ages?
Examples of Resources
- CDC Wonder (https://wonder.cdc.gov/): Data include heat wave days, daily air temperatures and heat indices, daily sunlight, daily precipitation, daily land surface temperatures, and daily fine particulate matter.
- North America Land Data Assimilation System (NLDAS) (https://ldas.gsfc.nasa.gov/): Data include daily air temperatures and heat indices, daily sunlight, and daily precipitation.
- Moderate Resolution Imaging Spectroradiometer (MODIS) (https://modis.gsfc.nasa.gov/data/dataprod/mod11.php): Data include land surface temperatures and aerosol optical depth.
5. An icy glaire
Polar quest

Разработать квест о полярных экспедициях и изменениях в криосфере. Особенно стоит уделить внимание изменениям за последние 10, 30, 100 лет.
Background
Traveling in the polar regions can be quite challenging. The locations are remote, and the weather is extreme. Careful planning is required to have a successful trip!
Each year, scientists plan expeditions to the Earth’s cryosphere to conduct experiments and set up field sites. They use environmental data collected over many years to know what to expect, and models predict what kind of terrain and conditions they will likely face. It is important for them to be able to look back at past conditions, predict future conditions, and anticipate possible hazards or dangerous scenarios. Weather, terrain, route, food, and supplies all need to be considered.
On top of that, conditions in the cryosphere are changing. The area covered by Arctic sea ice is shrinking, glaciers are melting, and melt ponds can develop on the ice sheets in the summer months.
Potential Considerations
- When should your explorers leave?
- What kind of transportation will they take?
- What hazards will they face along the way?
- What supplies will they pack?
- What will the terrain look like (Sea ice? Glaciers?)
How can you present NASA data to help the explorers plan their trip? What data could the explorers use during their trip to avoid hazards that come up?
How would the quest be different if it occurred 10 years ago? 30 years ago? 100 years ago? What has changed in the environment?
Примеры ресурсов:
Find my cryosphere

Разработать приложение, позволяющее узнать как криосфера Земли воздействует на определенные локации, например, как ближайшие ледники меняют погоду в области.
Background
Where is your cryosphere?
The cryosphere encompasses the parts of the world where water is frozen. This includes frozen water on land— ice sheets, glaciers, snow, and frozen ground (permafrost)— as well as sea ice, lake ice, and river ice. Mostly, the cryosphere is found near the north and south poles and in the mountains. In winter, the cryosphere extends further south as the ground freezes and snow falls.
Although most people do not look out their window and see a frozen tundra, the cryosphere impacts everyone. Some communities are directly impacted by the cryosphere — they rely on frozen ice to travel and hunt, or to get their water from melting snow and glacier runoff. Other communities feel the impact of the cryosphere less directly. Weather patterns and sea levels around the world depend on the frozen poles and mountainous regions, for example.
Scientists, planners, policy makers, and citizens need to understand how the cryosphere, and changes in our frozen landscapes, affect everyone around the world.
Potential Considerations
Allow users to identify the nearest glacier, area of permafrost, snowpack, ice sheet, etc.
How far away is the nearest glacier? Ice sheet? Snow pack?
How does access to food, water, and shelter depend on the cryosphere? What about lifestyle or recreation?
How would life change in your location if that piece of the cryosphere changed? Disappeared?
How does the food in your location (crops, fish, etc.) depend on the cryosphere?
Design creative and interesting ways to display the data!
Примеры ресурсов:
Polar opposites
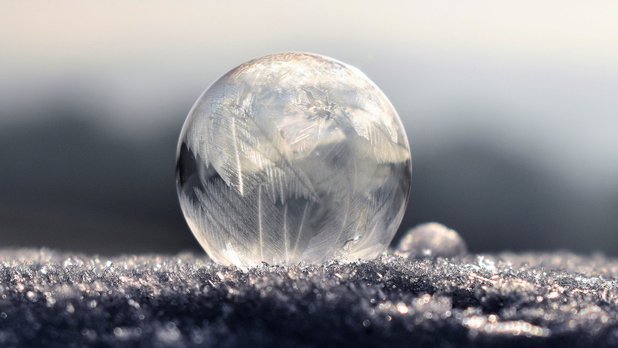
Создать инструмент анализа и визуализации данных, который покажет изменения во льдах Арктики и Антарктики для широкой аудитории.
Background
The Arctic and Antarctica are polar opposites, not just because they house the North and South Poles, respectively, but also because their geographies are opposite as well! The Arctic is a semi-closed ocean almost entirely surrounded by land, while Antarctica is a landmass that is entirely surrounded by an ocean.
Data about ice at the poles aren«t just useful to scientists who study the cryosphere, but they are also useful for international trade (sea ice forecasts for the Northwest Passage), and planetary science (comparing changing ice on Earth to that on other planets).
NASA studies help us understand how ice structures in the Arctic and Antarctica are evolving in a changing environment. In addition to presence and absence of sea ice, ice sheets are also observed in three dimensions, so that measurements of how the sheets are changing from above and below, as well as side-to-side, can be made.
Analyze and visualize NASA«s Arctic and/or Antarctic ice sheets and sea ice data to tell their story over time and over the three spatial dimensions. In addition to seasonal changes in the extent of the ice, are there other patterns of change to be seen? For example, are there differences in ice coverage in the same location between one day of the year (e.g. April 29, 2017) and the same day of other years (April 29, 2016; April 29, 2015; and so on…)?
Potential Considerations
Consider comparing changes in ice sheets and sea ice over time and space with atmospheric and ocean conditions in the two regions.
Examples of Resources
*NASA in no way endorses any particular entity listed, nor can it attest to the accuracy of information provided on non-US Government sites.
- NASA repository for polar data and other information about polar science at the National Snow and Ice Data Center (NSIDC) Distributed Active Archive Center — earthdata.nasa.gov/about/daacs/daac-nsidc
- ArcticDEM (digital elevation model) — This is a map of the land surface elevation for (nearly) the entire Arctic, at one snapshot in time
- IceBridge DEM — This map of the land surface elevation captures multiple points in time.
- Land, Vegetation, and Ice Sensor (LVIS) — Measures the height of vegetation in the polar regions.
- Gravity anomalies from AIRGrav — Measures how the gravity differs in local regions (which happens due to more or less local mass, e.g. mountains)
- IceBridge Image Gallery
6. A Universe of beauty and wonder
On the Shoulders of Giants
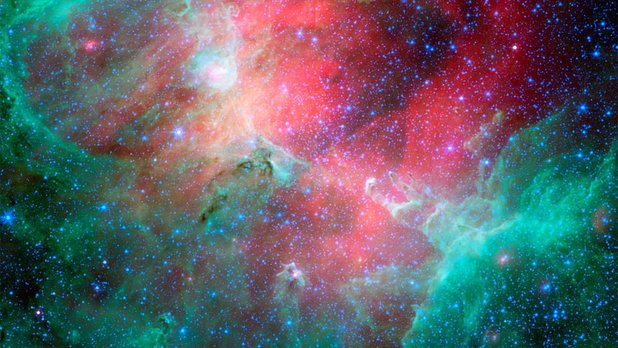
Создать игру используя снимки телескопа Hubble. Результатом может быть прототип настольной, карточной, компьютерной, мобильной или VR игры.
Background
Since the early 1990«s, NASA«s Hubble Space Telescope has provided the world with a nonstop stream of data that has helped resolve some of the biggest questions in astronomy — while providing fodder for brand-new questions, as well. As the first major optical telescope to be placed in space, Hubble views the universe from an unobstructed vantage point above the distortion of the atmosphere, far above Earth«s clouds and light pollution. Scientists have used Hubble to observe the most distant stars and galaxies as well as the planets in our solar system.
The Hubble Space Telescope has made more than 1.3 million observations since its launch, as it whirls around Earth at 17,000 miles per hour. It has peered back into the distant past, to locations more than 13.4 billion light-years from Earth — and yet it can view objects as nearby and small as the collision of asteroids in our own solar system. The scientific discoveries that have resulted are legendary — and as it has done all these things, it has also given us images of stars, galaxies, and nebulae that are awe-inspiring and stunningly beautiful. Hubble images are not CGI; they are not simulations. They are REAL, and they have shown us our universe as we had never seen it before.
Your job is to create a game using Hubble images as integral components of the game-play. You can design and prototype a board game, a card game, a computer game, an app or virtual reality game. You can make it competitive or collaborative, from single-player to massively multiplayer; you can focus on the science, the aesthetics, the inspiration, or all three — the choice, and the story of your game, are up to you.
Примеры ресурсов:
Remix the golden record
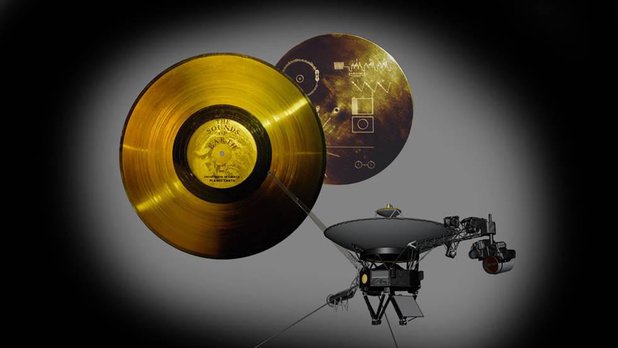
Разработать концепт капсулы времени, которая рассказала бы внеземным цивилизациям о человеческой культуре и солнечной системе. Потребуются инженерные навыки для создания прототипа и философский подход к содержанию капсулы.
Background
Several interstellar communications— containing music, math, science, art, and more— are aboard satellites or radio waves exiting our solar system. They were developed to inform an advanced civilization of our many human cultures and our local star system. Physical communications have used diagrams to deliver instructions for deciphering their content, the location of our Sun, etc. Radio communications have been transmitted from ground-based radio telescopes and targeted at specific star systems. Examples of these projects include the Pioneer plaques, Voyager golden records, the Arecibo message, Teen Age Message, and Cosmic Call messages.
Your challenge is to design content to educate an advanced spacefaring civilization about humanity and our solar system. Your concept should be able to be integrated into a time capsule and flown aboard an interstellar spacecraft.
Potential Considerations
Form as diverse a team as possible. The team may include members with diverse disciplines, such as philosophers, artists, musicians, mathematicians, scientists, engineers, etc.
What type of content will your team include to capture the essence of humanity and our solar system? How would the content be stored in a time capsule, and how would the target civilization decipher the content? The civilization may need to «play back» the recordings. So think about how the content would be recorded (i.e. language, diagrams, math, etched recordings, etc.), and how it would be accessed by the audience. Also consider how the time capsule could stand the test of time, because it may not be discovered until tens of thousands—or more— years from today.
What did previous communication missions do right? Can your team improve upon their methods? Think about what technology is available today compared to the technology available during the previous missions. Whatever technology you envision using, you should explain your approach, and show how your time capsule will withstand both time and the long journey through space.
There are many resources available on the internet to research how the Voyager golden records were developed. Think about how the Golden Record team approached the project and narrowed down content to include only the most important representations of our cultures. Other available resources may be used to discover how the various extraterrestrial communications projects include clever ways of encoding messages and making decisions on what content to include.
Примеры ресурсов:
Mission to the Moon
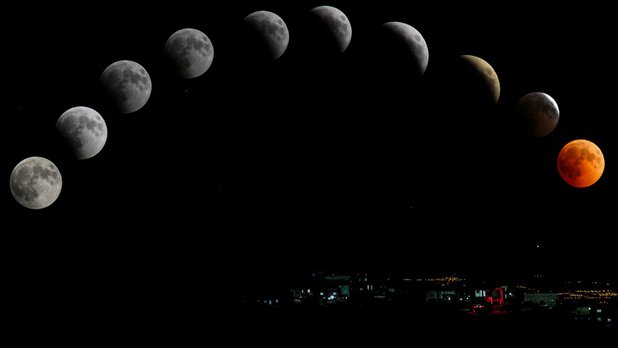
Спланировать исследовательскую миссию на Луну: определить задачи миссии, определить место посадки планетохода.
Background
Scientists wouldn«t send a rover to the moon without a detailed plan. There are numerous scientific and engineering considerations that would come into play in deciding what research a lunar rover will conduct, including where it will land. Scientists use imaging data from satellites orbiting the moon to learn about its surface and guide their decision-making to choose scientifically significant landing sites.
Astro-visualization software tools allow users to visualize the universe. Some of these tools incorporate NASA data, which NASA scientists use to plan and interpret scientific observations from space-based instruments aboard robotic spacecraft.
Your challenge is to use NASA data to create a lunar rover mission plan to the moon, and to use astro-visualization to identify and evaluate possible landing sites for a lunar rover.
Potential Considerations
As you develop your mission plan and visualization, you may consider the following criteria for choosing a moon-landing site for a lunar rover:
- What are the scientific goals of your mission? What do you hope to learn?
- Will a rover be able to land safely and travel easily at the landing site?
- Is it possible for a rover to search for water at the landing site?
- How much of the moon«s geological past can be studied at the landing site?
Примеры ресурсов:
Virtual space exploration
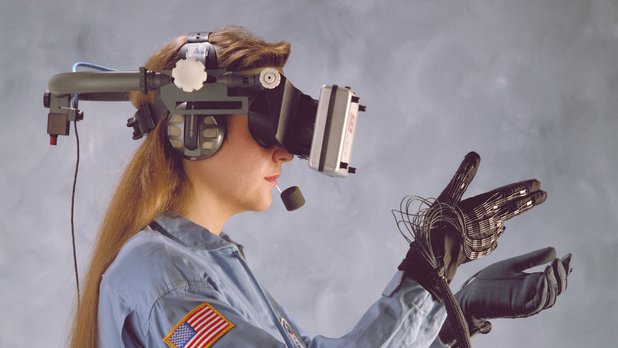
Воссоздать локацию с Луны или Марса в VR. В Вашем распоряжении модели поверхности высокого качества от проекта High Resolution Imaging Science.
The Challenge
Generate Virtual Reality environments for the surface of the Moon and Mars! Obtain 3D models from NASA resources, such as Moon Trek and Mars Trek. Integrate 3D models of surface exploration systems and habitats. Develop and deploy the virtual world at a hosting service.
Background
Interesting areas of the Moon or Mars could be near the North or South Poles, or any regions that have remarkable surface features. For example, flat areas are attractive as places to land. Permanently shadowed craters may have frozen water at the bottom of them. Skylights are holes that lead to lava tubes that could provide shelter. Areas rich in nickel and titanium are important from the perspective of manufacturing.
Virtual Reality (VR) enables anyone to explore the Moon and Mars from a distance. With the web apps Moon Trek and Mars Trek, it«s possible to create models that are suitable for VR or 3D printing. Digital Terrain Models from the High Resolution Imaging Science Experiment (HiRISE) can be converted into 3D surface models.
Your challenge is to create VR experiences that enable the public to explore the Moon and/or Mars.
This challenge involves VR models of areas of interest on the surfaces of the Moon and Mars, but you can also add surface exploration assets. Your VR environment could provide interactivity, such as riding a lander to the surface, or driving a rover.
Potential Considerations
To complete this challenge you may consider the following:
Several websites offer free hosting of VR models and popular game engines are available for free for self-education. Developing a VR model will require some work with a 3D graphics program. Typically, 3D graphics programs and game engines include a script editor to define behaviors. Depending upon the program, the scripting language might be Python, JavaScript,
